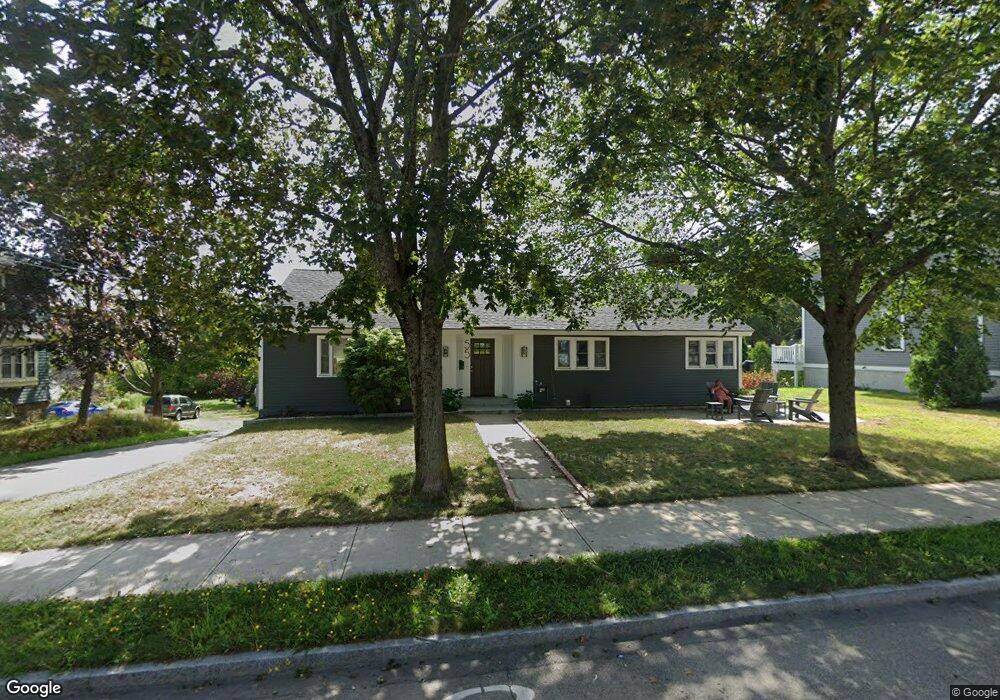
55 Lafayette Rd Portsmouth, NH 03801
Estimated Value: $1,023,000 - $1,182,000
4
Beds
2
Baths
2,352
Sq Ft
$458/Sq Ft
Est. Value
About This Home
This home is located at 55 Lafayette Rd, Portsmouth, NH 03801 and is currently estimated at $1,078,130, approximately $458 per square foot. 55 Lafayette Rd is a home located in Rockingham County with nearby schools including Little Harbour School, Portsmouth Middle School, and Portsmouth High School.
Ownership History
Date
Name
Owned For
Owner Type
Purchase Details
Closed on
Aug 17, 2022
Sold by
512 Sprbrook Circle Llc
Bought by
Chasser-Craigue Sharon
Current Estimated Value
Purchase Details
Closed on
Feb 12, 2015
Sold by
Barrow Kristin R
Bought by
Barrows Wayne and Ricciardi-Barrows Kristin
Home Financials for this Owner
Home Financials are based on the most recent Mortgage that was taken out on this home.
Original Mortgage
$227,400
Interest Rate
3.9%
Mortgage Type
New Conventional
Purchase Details
Closed on
Nov 12, 2003
Sold by
Schwartz Louis and Schwartz Sadye
Bought by
Ricciardi Kristin
Home Financials for this Owner
Home Financials are based on the most recent Mortgage that was taken out on this home.
Original Mortgage
$283,500
Interest Rate
5.81%
Mortgage Type
Purchase Money Mortgage
Create a Home Valuation Report for This Property
The Home Valuation Report is an in-depth analysis detailing your home's value as well as a comparison with similar homes in the area
Home Values in the Area
Average Home Value in this Area
Purchase History
| Date | Buyer | Sale Price | Title Company |
|---|---|---|---|
| Chasser-Craigue Sharon | $360,000 | None Available | |
| Barrows Wayne | -- | -- | |
| Ricciardi Kristin | $315,000 | -- |
Source: Public Records
Mortgage History
| Date | Status | Borrower | Loan Amount |
|---|---|---|---|
| Previous Owner | Barrows Wayne | $227,400 | |
| Previous Owner | Ricciardi Kristin | $75,100 | |
| Previous Owner | Ricciardi Kristin | $283,500 |
Source: Public Records
Tax History Compared to Growth
Tax History
| Year | Tax Paid | Tax Assessment Tax Assessment Total Assessment is a certain percentage of the fair market value that is determined by local assessors to be the total taxable value of land and additions on the property. | Land | Improvement |
|---|---|---|---|---|
| 2024 | $11,581 | $1,035,900 | $615,400 | $420,500 |
| 2023 | $10,422 | $646,100 | $366,400 | $279,700 |
| 2022 | $9,821 | $646,100 | $366,400 | $279,700 |
| 2021 | $9,711 | $646,100 | $366,400 | $279,700 |
| 2020 | $10,926 | $646,100 | $366,400 | $279,700 |
| 2019 | $9,750 | $656,100 | $376,400 | $279,700 |
| 2018 | $8,452 | $533,600 | $342,200 | $191,400 |
| 2017 | $8,124 | $528,200 | $342,200 | $186,000 |
| 2016 | $7,644 | $448,600 | $288,700 | $159,900 |
| 2015 | $7,461 | $444,400 | $288,700 | $155,700 |
| 2014 | $7,410 | $409,400 | $265,200 | $144,200 |
| 2013 | $7,332 | $409,400 | $265,200 | $144,200 |
| 2012 | $7,210 | $410,800 | $265,200 | $145,600 |
Source: Public Records
Map
Nearby Homes
- 97 Middle Rd
- 320 Thaxter Rd
- 6 Rockaway St
- 161 Wibird St
- 21 Madison St
- 5 Old Parish Way
- 150 Us Highway 1 Bypass Unit 209
- 34 Highland St
- 221 Hillside Dr
- 0 Elm Ct
- 238 Austin St
- 219 Sagamore Ave
- 490 Islington St Unit 1
- 149 Jones Ave
- 50 Cate St Unit 4
- 1230 Islington St
- Lot 44 Sims Ave
- 224 Cate St
- 25 Morning St
- #2 Woodbury Reserve Unit 2
- 55 Lafayette Rd Unit Lot 2
- 65 Lafayette Rd
- 229 Willard Ave
- 39 Lafayette Rd
- 91 Lafayette Rd
- 227 Willard Ave
- 60 Lafayette Rd
- 25 Lafayette Rd
- 70 Lafayette Rd
- 40 Middle Rd
- 3 Lafayette Rd Unit 3B
- 205 Willard Ave
- 58 Middle Rd
- 228 Willard Ave
- 15 Lafayette Rd
- 222 Willard Ave
- 222 Willard Ave Unit 1
- 2 Monroe St
- 248 Willard Ave
- 18 Monroe St