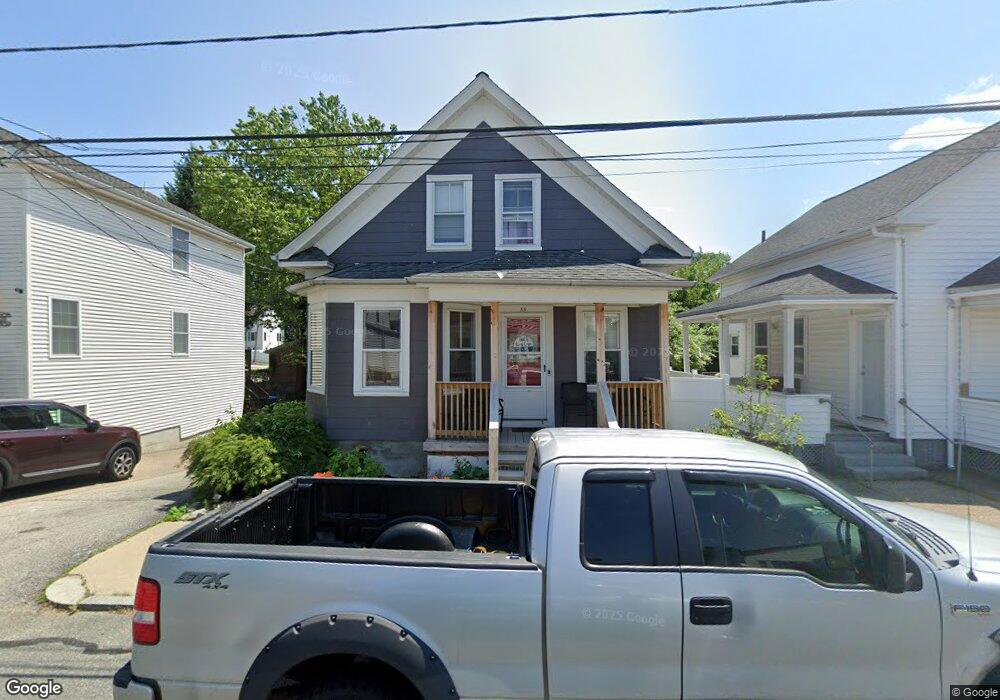
55 Leo Ave Providence, RI 02904
Charles NeighborhoodEstimated Value: $364,284 - $415,000
3
Beds
2
Baths
1,007
Sq Ft
$390/Sq Ft
Est. Value
About This Home
This home is located at 55 Leo Ave, Providence, RI 02904 and is currently estimated at $393,071, approximately $390 per square foot. 55 Leo Ave is a home located in Providence County with nearby schools including Times Squared Academy, Times2 Middle/High School, and The San Miguel School.
Ownership History
Date
Name
Owned For
Owner Type
Purchase Details
Closed on
Jun 29, 2018
Sold by
Farquharson Kenisha
Bought by
Witter Rose M
Current Estimated Value
Purchase Details
Closed on
Oct 1, 2008
Sold by
Feldman Rhonda F and Tassoni Ronald
Bought by
Farguharson Kenisha
Home Financials for this Owner
Home Financials are based on the most recent Mortgage that was taken out on this home.
Original Mortgage
$139,215
Interest Rate
6.54%
Mortgage Type
Purchase Money Mortgage
Create a Home Valuation Report for This Property
The Home Valuation Report is an in-depth analysis detailing your home's value as well as a comparison with similar homes in the area
Home Values in the Area
Average Home Value in this Area
Purchase History
| Date | Buyer | Sale Price | Title Company |
|---|---|---|---|
| Witter Rose M | -- | -- | |
| Farguharson Kenisha | $142,000 | -- |
Source: Public Records
Mortgage History
| Date | Status | Borrower | Loan Amount |
|---|---|---|---|
| Previous Owner | Farguharson Kenisha | $139,215 | |
| Previous Owner | Farguharson Kenisha | $10,500 |
Source: Public Records
Tax History
| Year | Tax Paid | Tax Assessment Tax Assessment Total Assessment is a certain percentage of the fair market value that is determined by local assessors to be the total taxable value of land and additions on the property. | Land | Improvement |
|---|---|---|---|---|
| 2025 | $2,672 | $318,100 | $128,000 | $190,100 |
| 2024 | $4,160 | $226,700 | $84,000 | $142,700 |
| 2023 | $4,160 | $226,700 | $84,000 | $142,700 |
| 2022 | $4,035 | $226,700 | $84,000 | $142,700 |
| 2021 | $3,772 | $153,600 | $61,000 | $92,600 |
| 2020 | $3,772 | $153,600 | $61,000 | $92,600 |
| 2019 | $3,772 | $153,600 | $61,000 | $92,600 |
| 2018 | $3,615 | $113,100 | $47,100 | $66,000 |
| 2017 | $3,615 | $113,100 | $47,100 | $66,000 |
| 2016 | $3,615 | $113,100 | $47,100 | $66,000 |
| 2015 | $3,449 | $104,200 | $47,700 | $56,500 |
| 2014 | $3,517 | $104,200 | $47,700 | $56,500 |
| 2013 | $3,517 | $104,200 | $47,700 | $56,500 |
Source: Public Records
Map
Nearby Homes
- 45 Leo Ave
- 862 Charles St
- 10 Josephine St Unit 207
- 10 Josephine St Unit 310
- 3 Victor Emanuel Ave
- 19 Benedict St
- 20 Hurdis St Unit 1
- 730 Charles St
- 19 Newbury St
- 209 Windmill St
- 0 Piave St
- 136 Windmill St
- 119 Edgeworth Ave
- 93 Paul St
- 1002 Charles St
- 40 Wilna St
- 31 Washington St
- 116 Toledo Ave
- 62 Russo St
- 3 Cassisi Ct
Your Personal Tour Guide
Ask me questions while you tour the home.