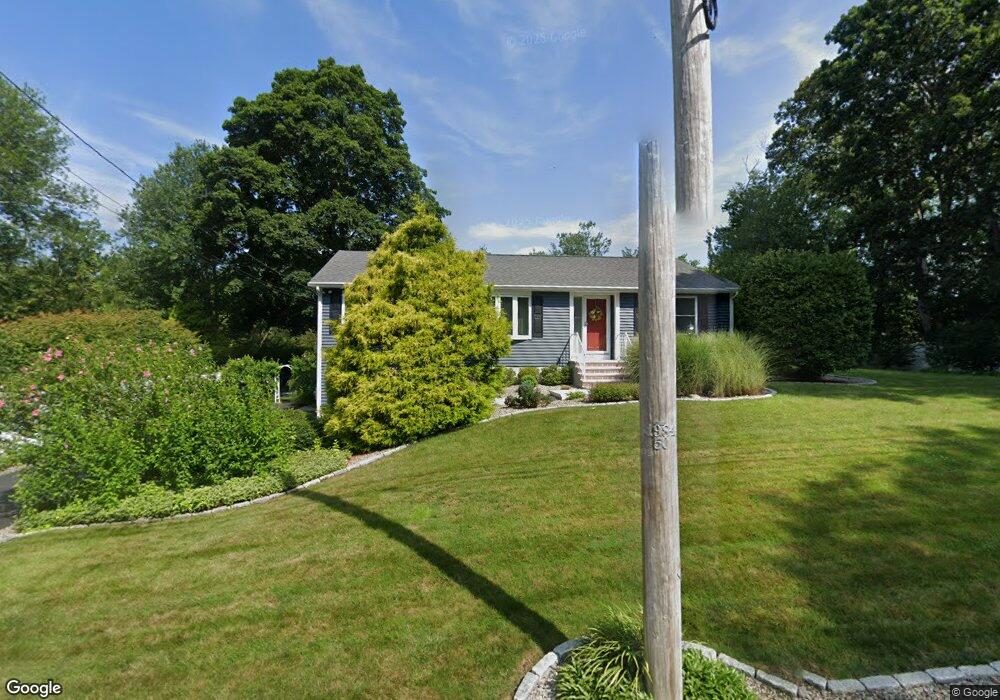
55 Middle St Attleboro, MA 02703
Estimated Value: $552,291 - $621,000
3
Beds
2
Baths
1,194
Sq Ft
$488/Sq Ft
Est. Value
About This Home
This home is located at 55 Middle St, Attleboro, MA 02703 and is currently estimated at $582,573, approximately $487 per square foot. 55 Middle St is a home located in Bristol County with nearby schools including Hill-Roberts Elementary School, Robert J. Coelho Middle School, and Attleboro High School.
Ownership History
Date
Name
Owned For
Owner Type
Purchase Details
Closed on
Oct 31, 2000
Sold by
Alegi Rpbert A and Alegi Susanne H
Bought by
Chartier Mark D and Chartier Christine M
Current Estimated Value
Home Financials for this Owner
Home Financials are based on the most recent Mortgage that was taken out on this home.
Original Mortgage
$161,600
Outstanding Balance
$59,334
Interest Rate
7.83%
Mortgage Type
Purchase Money Mortgage
Estimated Equity
$523,239
Purchase Details
Closed on
Jun 28, 1996
Sold by
Brady John P and Brady Marcia J
Bought by
Alegi Robert A and Allegi Susanne H
Create a Home Valuation Report for This Property
The Home Valuation Report is an in-depth analysis detailing your home's value as well as a comparison with similar homes in the area
Home Values in the Area
Average Home Value in this Area
Purchase History
| Date | Buyer | Sale Price | Title Company |
|---|---|---|---|
| Chartier Mark D | $205,000 | -- | |
| Alegi Robert A | $52,000 | -- |
Source: Public Records
Mortgage History
| Date | Status | Borrower | Loan Amount |
|---|---|---|---|
| Open | Alegi Robert A | $161,600 | |
| Previous Owner | Alegi Robert A | $44,758 | |
| Previous Owner | Alegi Robert A | $140,400 | |
| Previous Owner | Alegi Robert A | $43,700 |
Source: Public Records
Tax History
| Year | Tax Paid | Tax Assessment Tax Assessment Total Assessment is a certain percentage of the fair market value that is determined by local assessors to be the total taxable value of land and additions on the property. | Land | Improvement |
|---|---|---|---|---|
| 2025 | $6,127 | $488,200 | $174,100 | $314,100 |
| 2024 | $5,678 | $446,000 | $156,800 | $289,200 |
| 2023 | $5,557 | $405,900 | $158,400 | $247,500 |
| 2022 | $5,310 | $367,500 | $151,000 | $216,500 |
| 2021 | $4,884 | $330,000 | $145,200 | $184,800 |
| 2020 | $3,243 | $322,600 | $138,600 | $184,000 |
| 2019 | $2,876 | $316,000 | $136,000 | $180,000 |
| 2018 | $4,356 | $293,900 | $132,000 | $161,900 |
| 2017 | $2,565 | $273,500 | $128,600 | $144,900 |
| 2016 | $3,668 | $247,500 | $120,000 | $127,500 |
| 2015 | $3,663 | $249,000 | $120,000 | $129,000 |
| 2014 | $3,399 | $228,900 | $114,800 | $114,100 |
Source: Public Records
Map
Nearby Homes
Your Personal Tour Guide
Ask me questions while you tour the home.