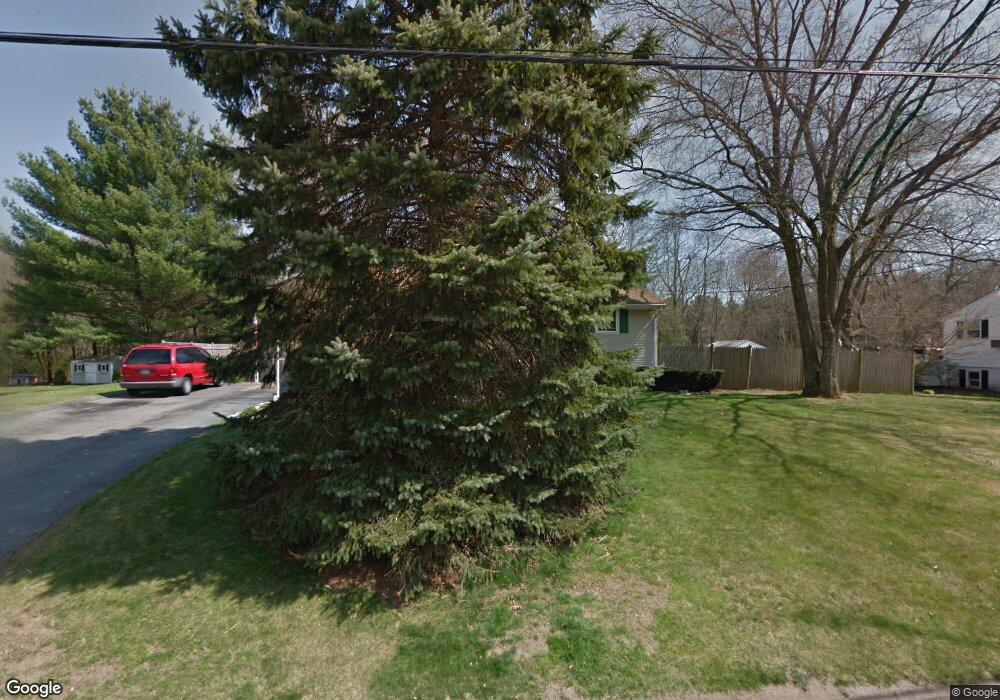
55 Nicholas Rd Raynham, MA 02767
Estimated Value: $497,000 - $562,000
3
Beds
1
Bath
1,500
Sq Ft
$354/Sq Ft
Est. Value
About This Home
This home is located at 55 Nicholas Rd, Raynham, MA 02767 and is currently estimated at $530,281, approximately $353 per square foot. 55 Nicholas Rd is a home located in Bristol County with nearby schools including Merrill Elementary School, LaLiberte Elementary School, and Williams Intermediate School.
Ownership History
Date
Name
Owned For
Owner Type
Purchase Details
Closed on
Feb 19, 2003
Sold by
Catalano James M and Kane Susan D
Bought by
Condon Christopher and Condon Elizabeth A
Current Estimated Value
Home Financials for this Owner
Home Financials are based on the most recent Mortgage that was taken out on this home.
Original Mortgage
$201,000
Interest Rate
5.98%
Mortgage Type
Purchase Money Mortgage
Purchase Details
Closed on
Oct 8, 1992
Sold by
Furtado Joan and Furtado Edward J
Bought by
Catalano James M and Kane Susan D
Create a Home Valuation Report for This Property
The Home Valuation Report is an in-depth analysis detailing your home's value as well as a comparison with similar homes in the area
Home Values in the Area
Average Home Value in this Area
Purchase History
| Date | Buyer | Sale Price | Title Company |
|---|---|---|---|
| Condon Christopher | $274,000 | -- | |
| Catalano James M | $125,600 | -- |
Source: Public Records
Mortgage History
| Date | Status | Borrower | Loan Amount |
|---|---|---|---|
| Open | Catalano James M | $261,250 | |
| Closed | Condon Christopher | $201,000 | |
| Previous Owner | Catalano James M | $141,415 |
Source: Public Records
Tax History
| Year | Tax Paid | Tax Assessment Tax Assessment Total Assessment is a certain percentage of the fair market value that is determined by local assessors to be the total taxable value of land and additions on the property. | Land | Improvement |
|---|---|---|---|---|
| 2025 | $5,110 | $422,300 | $208,600 | $213,700 |
| 2024 | $4,872 | $392,300 | $189,600 | $202,700 |
| 2023 | $4,740 | $348,500 | $170,700 | $177,800 |
| 2022 | $4,688 | $316,100 | $161,200 | $154,900 |
| 2021 | $4,425 | $301,200 | $151,700 | $149,500 |
| 2020 | $4,169 | $289,300 | $144,100 | $145,200 |
| 2019 | $3,982 | $279,800 | $134,600 | $145,200 |
| 2018 | $3,788 | $254,200 | $127,100 | $127,100 |
| 2017 | $3,552 | $236,300 | $121,400 | $114,900 |
| 2016 | $3,483 | $232,500 | $117,600 | $114,900 |
| 2015 | $3,577 | $234,700 | $122,500 | $112,200 |
Source: Public Records
Map
Nearby Homes
- 53 Queens Cir
- 30 Edward Rd
- 21 Sully Rd
- 68 Michael Rd
- 935 King St
- 26 Nottingham Dr
- 173 Titicut Rd
- 224 Whippoorwill Dr
- 75 Warren St W Unit 16
- 35 Spruce St
- 30 Spruce St
- 678 Pine St
- 858 Pine St Unit Model
- 698 Pine St
- 0 Cape Highway Route 44 Unit 73474847
- 152 Forgeriver
- 5 Parcels Cape Highway Route 44
- 84 Diniz Dr
- 208 S Main St
- 22 Highland Rd Unit 29
Your Personal Tour Guide
Ask me questions while you tour the home.