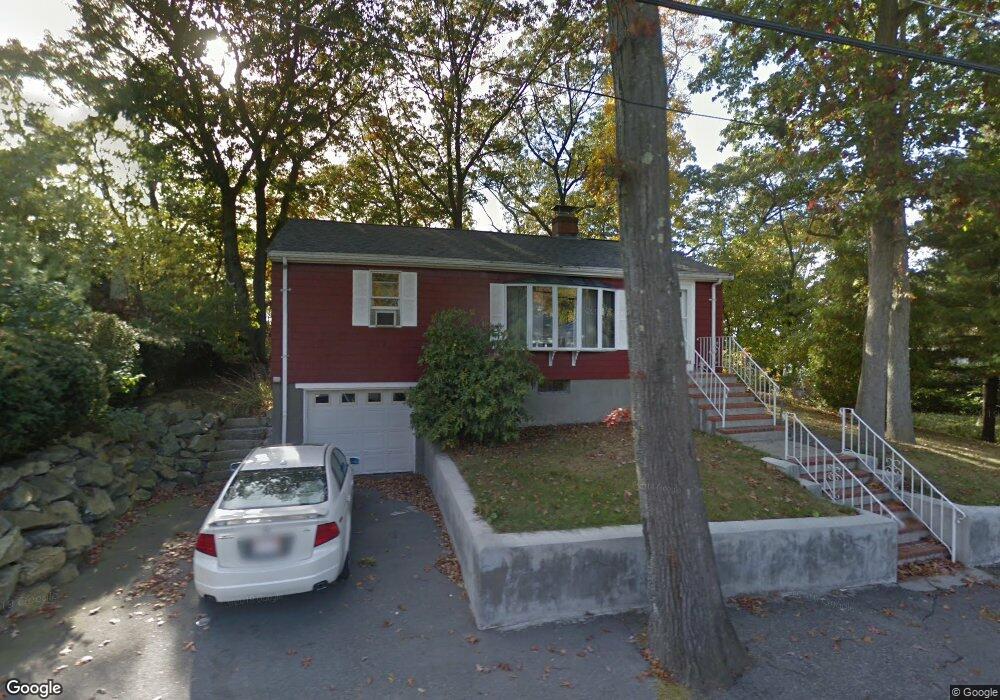
55 Nichols Rd Malden, MA 02148
Forestdale NeighborhoodEstimated Value: $642,000 - $781,000
2
Beds
1
Bath
968
Sq Ft
$722/Sq Ft
Est. Value
About This Home
This home is located at 55 Nichols Rd, Malden, MA 02148 and is currently estimated at $698,468, approximately $721 per square foot. 55 Nichols Rd is a home located in Middlesex County with nearby schools including Malden High School, Cheverus Catholic School, and Malden Catholic.
Ownership History
Date
Name
Owned For
Owner Type
Purchase Details
Closed on
Jun 10, 2021
Sold by
Monahan Thomas J
Bought by
T J Monahan Sr 2021 T
Current Estimated Value
Purchase Details
Closed on
Jan 20, 2011
Sold by
Carlton Lois W
Bought by
Monahan Thomas J
Home Financials for this Owner
Home Financials are based on the most recent Mortgage that was taken out on this home.
Original Mortgage
$260,000
Interest Rate
4.62%
Mortgage Type
Purchase Money Mortgage
Create a Home Valuation Report for This Property
The Home Valuation Report is an in-depth analysis detailing your home's value as well as a comparison with similar homes in the area
Home Values in the Area
Average Home Value in this Area
Purchase History
| Date | Buyer | Sale Price | Title Company |
|---|---|---|---|
| T J Monahan Sr 2021 T | -- | None Available | |
| Monahan Thomas J | $280,000 | -- |
Source: Public Records
Mortgage History
| Date | Status | Borrower | Loan Amount |
|---|---|---|---|
| Previous Owner | Monahan Thomas J | $260,000 |
Source: Public Records
Tax History Compared to Growth
Tax History
| Year | Tax Paid | Tax Assessment Tax Assessment Total Assessment is a certain percentage of the fair market value that is determined by local assessors to be the total taxable value of land and additions on the property. | Land | Improvement |
|---|---|---|---|---|
| 2025 | $70 | $614,100 | $399,700 | $214,400 |
| 2024 | $6,624 | $566,600 | $376,200 | $190,400 |
| 2023 | $6,314 | $518,000 | $340,900 | $177,100 |
| 2022 | $5,975 | $483,800 | $311,600 | $172,200 |
| 2021 | $5,653 | $460,000 | $293,900 | $166,100 |
| 2020 | $5,532 | $437,300 | $271,600 | $165,700 |
| 2019 | $5,446 | $410,400 | $258,700 | $151,700 |
| 2018 | $5,091 | $361,300 | $214,600 | $146,700 |
| 2017 | $5,120 | $361,300 | $214,600 | $146,700 |
| 2016 | $4,912 | $324,000 | $197,000 | $127,000 |
| 2015 | $4,813 | $306,000 | $187,600 | $118,400 |
| 2014 | $4,655 | $289,100 | $170,600 | $118,500 |
Source: Public Records
Map
Nearby Homes
- 7 Sawyer Ct
- 26 Webber St Unit 1
- 163 Sylvan St
- 0 Beachview Ave
- 59 Dexter Rd
- 14 Dodge St
- 0 S Mountain Avenue & O Cargil
- 98 Summit St
- 15 Mount Washington Ave
- 48 Summit St
- 31 Temple St
- 31 Preston St
- 65 Beacon St
- 115 Webster St
- 82 Elwell St
- 44 Loomis St Unit 209
- 7 Penny Hill Rd
- 56 Rocky Nook Unit 56
- 47 Rocky Nook Unit 47
- 1 Mill Rd