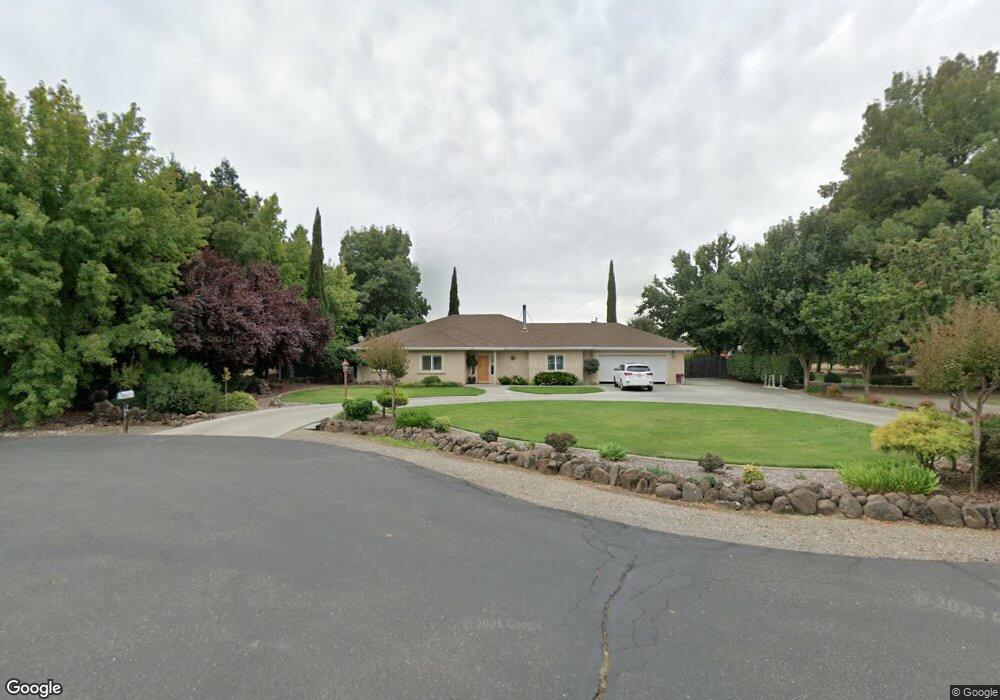
55 Nirvana Ct Red Bluff, CA 96080
Estimated Value: $399,000 - $457,548
3
Beds
3
Baths
1,839
Sq Ft
$234/Sq Ft
Est. Value
About This Home
This home is located at 55 Nirvana Ct, Red Bluff, CA 96080 and is currently estimated at $430,637, approximately $234 per square foot. 55 Nirvana Ct is a home located in Tehama County with nearby schools including Antelope Elementary School, Berrendos Middle School, and Red Bluff High School.
Ownership History
Date
Name
Owned For
Owner Type
Purchase Details
Closed on
Mar 20, 2012
Sold by
Poulton Dennis Clyde and Poulton Jeanette Rae
Bought by
Poulton Dennis Clyde and Poulton Jeanette Rae
Current Estimated Value
Home Financials for this Owner
Home Financials are based on the most recent Mortgage that was taken out on this home.
Original Mortgage
$145,000
Interest Rate
3.84%
Mortgage Type
New Conventional
Purchase Details
Closed on
Dec 15, 2008
Sold by
Poulton Dennis Clyde and Poulton Jeanette Rae
Bought by
Poulton Dennis Clyde and Poulton Jeanette Rae
Purchase Details
Closed on
Apr 16, 2006
Sold by
Poulton Dennis and Poulton Jeanette
Bought by
Poulton Dennis Clyde and Poulton Jeanette Rae
Create a Home Valuation Report for This Property
The Home Valuation Report is an in-depth analysis detailing your home's value as well as a comparison with similar homes in the area
Purchase History
| Date | Buyer | Sale Price | Title Company |
|---|---|---|---|
| Poulton Dennis Clyde | -- | Placer Title Company | |
| Poulton Dennis Clyde | -- | Placer Title Company | |
| Poulton Dennis Clyde | -- | Fidelity Natl Title Co Of Ca | |
| Poulton Dennis Clyde | -- | Fidelity Natl Title Co Of Ca | |
| Poulton Dennis Clyde | -- | Napa Land Title Company |
Source: Public Records
Mortgage History
| Date | Status | Borrower | Loan Amount |
|---|---|---|---|
| Closed | Poulton Dennis Clyde | $145,000 |
Source: Public Records
Tax History
| Year | Tax Paid | Tax Assessment Tax Assessment Total Assessment is a certain percentage of the fair market value that is determined by local assessors to be the total taxable value of land and additions on the property. | Land | Improvement |
|---|---|---|---|---|
| 2025 | $3,317 | $335,387 | $66,076 | $269,311 |
| 2023 | $3,271 | $322,365 | $63,511 | $258,854 |
| 2022 | $3,177 | $316,045 | $62,266 | $253,779 |
| 2021 | $3,120 | $309,849 | $61,046 | $248,803 |
| 2020 | $3,119 | $306,673 | $60,421 | $246,252 |
| 2019 | $3,106 | $300,661 | $59,237 | $241,424 |
| 2018 | $2,960 | $294,767 | $58,076 | $236,691 |
| 2017 | $2,985 | $288,988 | $56,938 | $232,050 |
| 2016 | $2,786 | $283,322 | $55,822 | $227,500 |
| 2015 | $2,742 | $279,067 | $54,984 | $224,083 |
| 2014 | $2,702 | $273,601 | $53,907 | $219,694 |
Source: Public Records
Map
Nearby Homes
- 23 Casa Grande Dr
- 1 Casa Grande Dr Unit 1
- 139 Casa Grande Dr
- 147 Casa Grande Dr
- 135 Casa Grande Dr
- 123 Casa Grande Dr
- 101 Casa Grande Dr
- 13 Casa Grande Dr
- 176 Casa Grande Dr
- 508 Antoinette Ct
- Lot 1 Paynes Creek Rd
- 566 Roundup Ave
- 14115 Trinity Ave
- 83 Damon Ave
- 65 Mary Ln
- 125 Kimick Way
- 105 Kimick Way
- 5 Gurnsey Ave
- 100 Dale Ave
- 321 Antelope Blvd
- 75 Nirvana Ct
- 35 Nirvana Ct
- 60 Nirvana Ct
- 549 West Ave
- 000 Mica Ct Unit Lot A
- 40 Nirvana Ct
- 80 Nirvana Ct
- 15 Nirvana Ct
- 20 Nirvana Ct
- Lot C Mica Ct
- Lot B Mica Ct
- Lot A Mica Ct
- 555 West Ave
- 715 West Ave
- 545 West Ave
- 504 Paynes Creek Rd Unit 506
- 504 Paynes Creek Rd
- 558 West Ave
- 500 Paynes Creek Rd
- 524 Kaer Ave
Your Personal Tour Guide
Ask me questions while you tour the home.