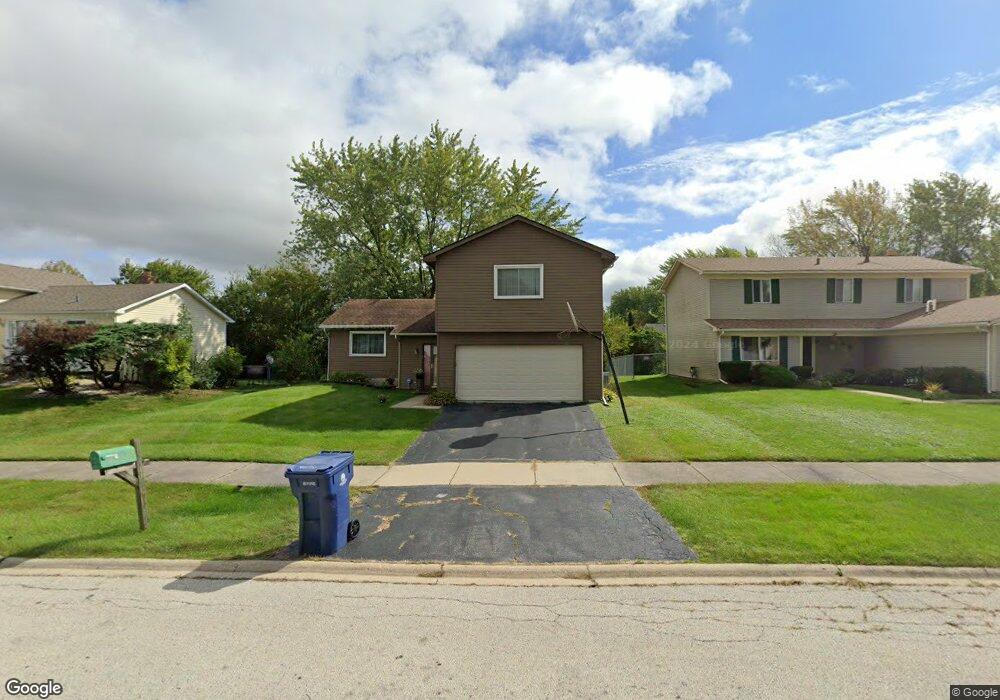
55 Oriole Rd Unit 3 Matteson, IL 60443
West Matteson NeighborhoodEstimated Value: $236,879 - $277,000
3
Beds
3
Baths
1,805
Sq Ft
$139/Sq Ft
Est. Value
About This Home
This home is located at 55 Oriole Rd Unit 3, Matteson, IL 60443 and is currently estimated at $251,470, approximately $139 per square foot. 55 Oriole Rd Unit 3 is a home located in Cook County with nearby schools including Colin Powell Middle School.
Ownership History
Date
Name
Owned For
Owner Type
Purchase Details
Closed on
Oct 27, 1998
Sold by
Melvin Derrick L
Bought by
Johnson Carol Diane
Current Estimated Value
Home Financials for this Owner
Home Financials are based on the most recent Mortgage that was taken out on this home.
Original Mortgage
$97,200
Outstanding Balance
$24,633
Interest Rate
9.7%
Estimated Equity
$226,837
Purchase Details
Closed on
Jul 23, 1998
Sold by
Fcms Reo Sub Corp
Bought by
Melvin Derrick L
Home Financials for this Owner
Home Financials are based on the most recent Mortgage that was taken out on this home.
Original Mortgage
$62,400
Interest Rate
9.85%
Create a Home Valuation Report for This Property
The Home Valuation Report is an in-depth analysis detailing your home's value as well as a comparison with similar homes in the area
Home Values in the Area
Average Home Value in this Area
Purchase History
| Date | Buyer | Sale Price | Title Company |
|---|---|---|---|
| Johnson Carol Diane | $108,000 | -- | |
| Melvin Derrick L | $78,000 | Prairie Title |
Source: Public Records
Mortgage History
| Date | Status | Borrower | Loan Amount |
|---|---|---|---|
| Open | Johnson Carol Diane | $97,200 | |
| Previous Owner | Melvin Derrick L | $62,400 | |
| Closed | Melvin Derrick L | $11,700 |
Source: Public Records
Tax History
| Year | Tax Paid | Tax Assessment Tax Assessment Total Assessment is a certain percentage of the fair market value that is determined by local assessors to be the total taxable value of land and additions on the property. | Land | Improvement |
|---|---|---|---|---|
| 2025 | $7,331 | $19,019 | $3,388 | $15,631 |
| 2024 | $7,331 | $19,019 | $3,388 | $15,631 |
| 2023 | $6,038 | $21,000 | $3,388 | $17,612 |
| 2022 | $6,038 | $14,699 | $2,965 | $11,734 |
| 2021 | $6,143 | $14,697 | $2,964 | $11,733 |
| 2020 | $6,055 | $14,697 | $2,964 | $11,733 |
| 2019 | $4,916 | $12,427 | $2,752 | $9,675 |
| 2018 | $4,841 | $12,427 | $2,752 | $9,675 |
| 2017 | $5,513 | $13,906 | $2,752 | $11,154 |
| 2016 | $4,665 | $11,512 | $2,541 | $8,971 |
| 2015 | $4,517 | $11,512 | $2,541 | $8,971 |
| 2014 | $4,421 | $11,512 | $2,541 | $8,971 |
| 2013 | $4,485 | $12,378 | $2,541 | $9,837 |
Source: Public Records
Map
Nearby Homes
- 115 Oriole Rd
- 123 Oriole Rd
- 124 Oriole Rd
- 152 Oakhurst Rd
- 25 Pheasant Rd
- 42 Pheasant Rd
- 141 Timberlane Rd
- 56 Timberlane Rd
- 133 Deerpath Rd
- 40 Huntingwood Rd
- 41 Willow Rd
- 156 Cloverleaf Rd
- 50 Willow Rd
- 13 Oakview Rd
- 5943 Woodgate Dr
- 6005 Woodgate Dr
- 72 White Oaks Rd
- 10 Wedgewood Rd
- 6128 Wedgewood Ct
- 34 Wedgewood Rd
Your Personal Tour Guide
Ask me questions while you tour the home.