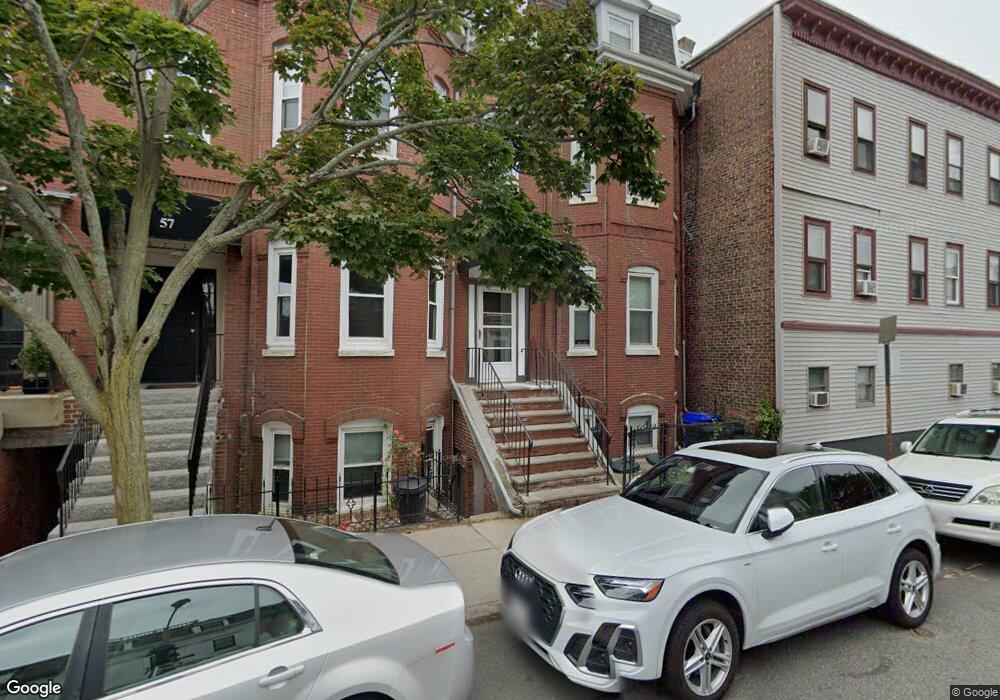
55 P St Boston, MA 02127
South Boston NeighborhoodEstimated Value: $1,437,637 - $1,944,000
6
Beds
3
Baths
2,145
Sq Ft
$796/Sq Ft
Est. Value
About This Home
This home is located at 55 P St, Boston, MA 02127 and is currently estimated at $1,707,159, approximately $795 per square foot. 55 P St is a home located in Suffolk County with nearby schools including South Boston Catholic Academy, Gate of Heaven Elementary School, and St Peter Academy.
Ownership History
Date
Name
Owned For
Owner Type
Purchase Details
Closed on
Jan 27, 2004
Sold by
Ayvazian Avedis H and Ayvazian Mary
Bought by
Hawe Frank E and Hawe Scott W
Current Estimated Value
Home Financials for this Owner
Home Financials are based on the most recent Mortgage that was taken out on this home.
Original Mortgage
$237,500
Interest Rate
5.89%
Mortgage Type
Purchase Money Mortgage
Create a Home Valuation Report for This Property
The Home Valuation Report is an in-depth analysis detailing your home's value as well as a comparison with similar homes in the area
Home Values in the Area
Average Home Value in this Area
Purchase History
| Date | Buyer | Sale Price | Title Company |
|---|---|---|---|
| Hawe Frank E | $250,000 | -- |
Source: Public Records
Mortgage History
| Date | Status | Borrower | Loan Amount |
|---|---|---|---|
| Open | Hawe Frank E | $38,000 | |
| Open | Hawe Frank E | $310,000 | |
| Closed | Hawe Frank E | $237,500 | |
| Previous Owner | Hawe Frank E | $83,400 |
Source: Public Records
Tax History
| Year | Tax Paid | Tax Assessment Tax Assessment Total Assessment is a certain percentage of the fair market value that is determined by local assessors to be the total taxable value of land and additions on the property. | Land | Improvement |
|---|---|---|---|---|
| 2025 | $18,169 | $1,569,000 | $538,800 | $1,030,200 |
| 2024 | $15,341 | $1,407,400 | $350,900 | $1,056,500 |
| 2023 | $13,999 | $1,303,400 | $325,000 | $978,400 |
| 2022 | $13,126 | $1,206,400 | $300,800 | $905,600 |
| 2021 | $12,619 | $1,182,700 | $294,900 | $887,800 |
| 2020 | $10,106 | $957,000 | $322,700 | $634,300 |
| 2019 | $9,172 | $870,200 | $218,700 | $651,500 |
| 2018 | $8,521 | $813,100 | $218,700 | $594,400 |
| 2017 | $7,828 | $739,200 | $218,700 | $520,500 |
| 2016 | $7,135 | $648,600 | $218,700 | $429,900 |
| 2015 | $6,888 | $568,800 | $178,000 | $390,800 |
| 2014 | $6,753 | $536,800 | $178,000 | $358,800 |
Source: Public Records
Map
Nearby Homes
- 933 E Broadway
- 901 E Broadway Unit 1
- 802 E 3rd St Unit 3
- 885 E Broadway
- 1 Twomey Ct Unit 40
- 37 Farragut Rd Unit 7
- 37 Farragut Rd Unit 6
- 37 Farragut Rd Unit Four
- 37 Farragut Rd Unit 3
- 37 Farragut Rd Unit 5
- 37 Farragut Rd Unit 2
- 881 E 2nd St Unit 13
- 881 E 2nd St Unit 7
- 867 E Broadway
- 861 E Broadway
- 7 Kemble Place
- 33 Lennon Ct Unit 39
- 840 E 4th St Unit 1
- 862 E 2nd St Unit 6
- 891 E 1st St Unit 4
- 807 E 3rd St
- 807 E 3rd St
- 807 E 3rd St Unit THREE
- 807 E 3rd St Unit 1
- 807 E 3rd St Unit 2
- 807 E 3rd St Unit 3
- 57 P St
- 57 P St Unit 1
- 803 E 3rd St
- 803 E 3rd St Unit 2
- 803 E 3rd St Unit 1
- 801 1/2 E 3rd St
- 59 P St Unit 3
- 59 P St Unit 2
- 59 P St Unit 1
- 61 P St
- 801 E 3rd St
- 63 P St
- 799 E 3rd St
- 799 E 3rd St Unit 1
Your Personal Tour Guide
Ask me questions while you tour the home.