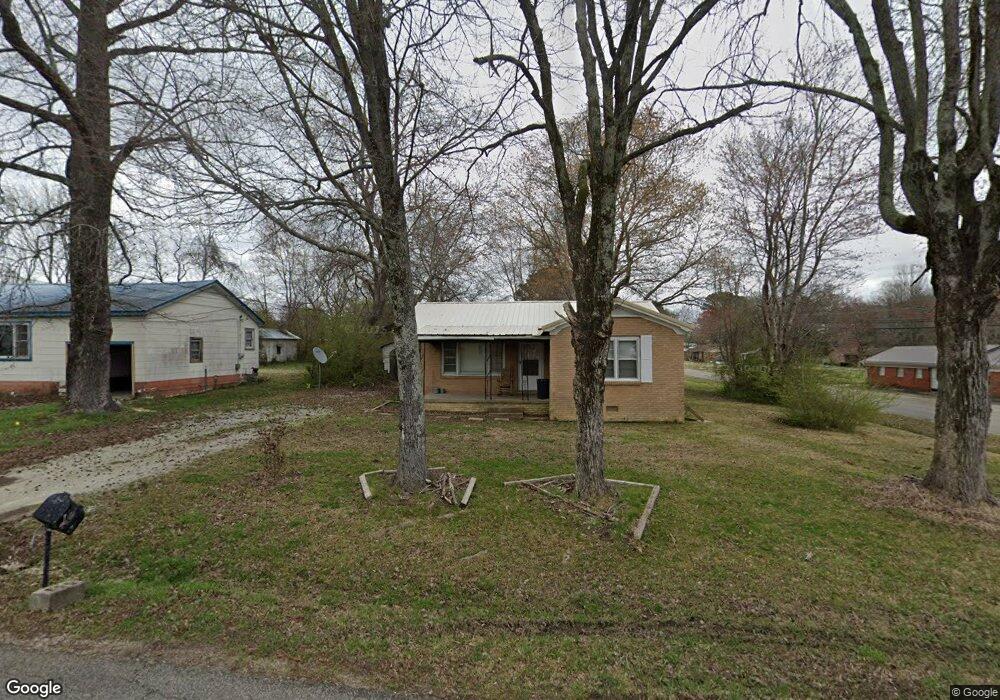
55 Price St Parsons, TN 38363
Estimated Value: $52,000 - $92,000
--
Bed
1
Bath
1,116
Sq Ft
$65/Sq Ft
Est. Value
About This Home
This home is located at 55 Price St, Parsons, TN 38363 and is currently estimated at $72,258, approximately $64 per square foot. 55 Price St is a home located in Decatur County with nearby schools including Parsons Elementary School, Decaturville Elementary School, and Decatur County Middle School.
Ownership History
Date
Name
Owned For
Owner Type
Purchase Details
Closed on
Sep 9, 2021
Sold by
Johnson Coy Andrew
Bought by
Tharp Doris
Current Estimated Value
Purchase Details
Closed on
Aug 20, 2021
Sold by
Logan Skyler and Broen Rhiannon Logan
Bought by
Johnson Coy Andrew
Purchase Details
Closed on
Aug 22, 2018
Sold by
Logan Skyler
Bought by
Logan Rhiannon
Purchase Details
Closed on
Oct 31, 2016
Sold by
Johnson Coy Andrew
Bought by
Logan Skyler and Logan Rhiannon
Home Financials for this Owner
Home Financials are based on the most recent Mortgage that was taken out on this home.
Original Mortgage
$40,408
Interest Rate
3.42%
Mortgage Type
New Conventional
Purchase Details
Closed on
Dec 16, 1999
Sold by
Inman J W
Bought by
Johnson Coy E
Purchase Details
Closed on
Apr 6, 1990
Bought by
Nancy Inman J and Nancy W
Purchase Details
Closed on
Jan 5, 1988
Bought by
Sims J D
Purchase Details
Closed on
Aug 28, 1975
Purchase Details
Closed on
Feb 25, 1974
Create a Home Valuation Report for This Property
The Home Valuation Report is an in-depth analysis detailing your home's value as well as a comparison with similar homes in the area
Home Values in the Area
Average Home Value in this Area
Purchase History
| Date | Buyer | Sale Price | Title Company |
|---|---|---|---|
| Tharp Doris | $32,000 | None Available | |
| Johnson Coy Andrew | $25,000 | None Available | |
| Logan Rhiannon | -- | None Available | |
| Logan Skyler | $40,000 | -- | |
| Johnson Coy E | $37,500 | -- | |
| Nancy Inman J | $36,500 | -- | |
| Sims J D | -- | -- | |
| -- | -- | -- | |
| -- | -- | -- |
Source: Public Records
Mortgage History
| Date | Status | Borrower | Loan Amount |
|---|---|---|---|
| Previous Owner | Logan Skyler | $40,408 |
Source: Public Records
Tax History Compared to Growth
Tax History
| Year | Tax Paid | Tax Assessment Tax Assessment Total Assessment is a certain percentage of the fair market value that is determined by local assessors to be the total taxable value of land and additions on the property. | Land | Improvement |
|---|---|---|---|---|
| 2025 | -- | $8,600 | $0 | $0 |
| 2024 | -- | $4,850 | $1,300 | $3,550 |
| 2023 | $159 | $4,850 | $1,300 | $3,550 |
| 2022 | $166 | $4,850 | $1,300 | $3,550 |
| 2021 | $366 | $10,650 | $1,300 | $9,350 |
| 2020 | $365 | $10,650 | $1,300 | $9,350 |
| 2019 | $344 | $10,925 | $1,075 | $9,850 |
| 2018 | $315 | $10,925 | $1,075 | $9,850 |
| 2017 | $321 | $10,925 | $1,075 | $9,850 |
| 2016 | $323 | $10,925 | $1,075 | $9,850 |
| 2015 | $322 | $10,875 | $1,075 | $9,800 |
| 2014 | $322 | $10,882 | $0 | $0 |
Source: Public Records
Map
Nearby Homes
- 724 Tennessee Ave S
- 41 E 7th St
- 174 Grice Ln
- 545 W 4th St
- 869 W 4th St
- 195 Glen Rich Dr
- 91 E 2nd St
- 0 E Main St Unit 242952
- x Highway 641 Hwy
- 279 Evans St
- 280 Evans St
- 2122 Old Decaturville Rd
- 109 Durbin Ln
- 0 Wilkinstown Rd
- 320 Wilkinstown Rd
- 559 Oakville Cir
- 500 Oakville Cir
- Lot 141 Creek Ridge Cove
- Lot 140 Creek Ridge Cove
- 39 Price St
- 125 E Morgan St
- 104 E Holley St
- 86 E Holley St
- 54 Price St
- 64 E Holley St
- 124 E Holley St
- 52 E Morgan St
- 46 E Holley St
- 165 E Morgan St
- 166 E Morgan St
- 877 Tennessee Ave S
- 156 E Holley St
- 135 E Holley St
- 183 E Morgan St
- 919 Kentucky Ave S
- 184 E Morgan St
- 155 E Holley St
- 180 E Holley St
- 171 E Holley St