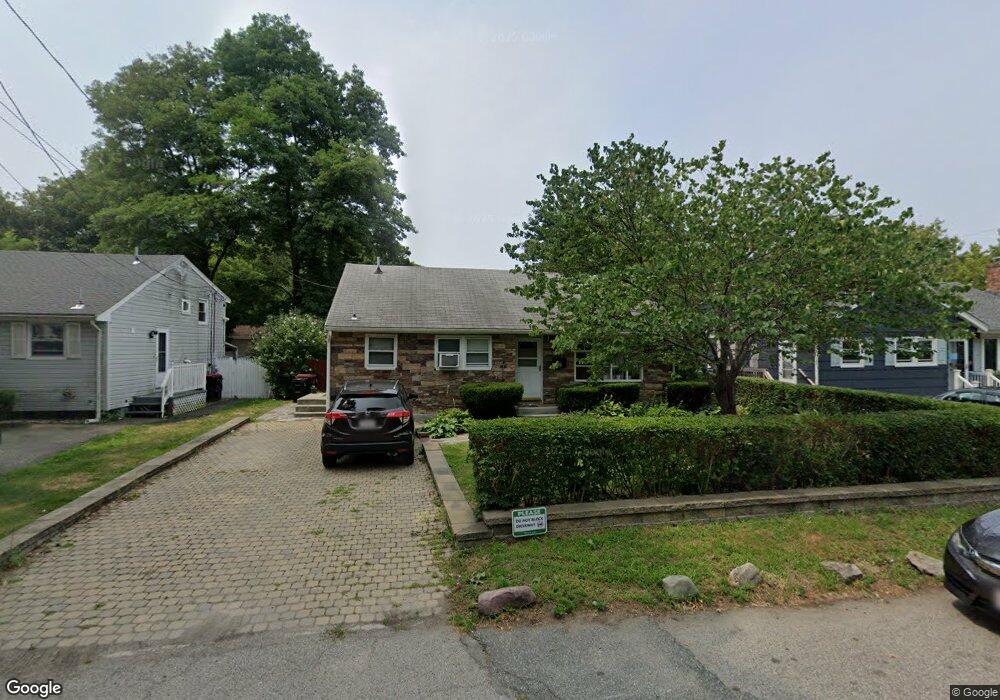
55 S Fuller St Brockton, MA 02301
Clifton Heights NeighborhoodEstimated Value: $459,000 - $503,000
3
Beds
2
Baths
972
Sq Ft
$497/Sq Ft
Est. Value
About This Home
This home is located at 55 S Fuller St, Brockton, MA 02301 and is currently estimated at $483,026, approximately $496 per square foot. 55 S Fuller St is a home located in Plymouth County with nearby schools including Louis F Angelo Elementary School, Raymond K-8 Elementary School, and Hancock Elementary School.
Ownership History
Date
Name
Owned For
Owner Type
Purchase Details
Closed on
Jun 22, 2023
Sold by
Hospedales Sheyanne
Bought by
55 South Fuller St Ext Rt and Hospedales
Current Estimated Value
Purchase Details
Closed on
Feb 10, 2009
Sold by
National Default Reo S
Bought by
Hospedales Anthony
Home Financials for this Owner
Home Financials are based on the most recent Mortgage that was taken out on this home.
Original Mortgage
$137,464
Interest Rate
5.2%
Mortgage Type
Purchase Money Mortgage
Purchase Details
Closed on
Nov 4, 2008
Sold by
Khang Xue and Yang Ly
Bought by
Citimortgage Inc
Purchase Details
Closed on
Jan 13, 2004
Sold by
Yang Ly
Bought by
Yang Ly and Khang Xue
Create a Home Valuation Report for This Property
The Home Valuation Report is an in-depth analysis detailing your home's value as well as a comparison with similar homes in the area
Home Values in the Area
Average Home Value in this Area
Purchase History
| Date | Buyer | Sale Price | Title Company |
|---|---|---|---|
| 55 South Fuller St Ext Rt | -- | None Available | |
| 55 South Fuller St Ext Rt | -- | None Available | |
| Hospedales Anthony | $140,000 | -- | |
| Citimortgage Inc | $121,652 | -- | |
| Yang Ly | -- | -- | |
| Hospedales Anthony | $140,000 | -- | |
| Citimortgage Inc | $121,652 | -- | |
| Yang Ly | -- | -- |
Source: Public Records
Mortgage History
| Date | Status | Borrower | Loan Amount |
|---|---|---|---|
| Previous Owner | Yang Ly | $137,464 |
Source: Public Records
Tax History Compared to Growth
Tax History
| Year | Tax Paid | Tax Assessment Tax Assessment Total Assessment is a certain percentage of the fair market value that is determined by local assessors to be the total taxable value of land and additions on the property. | Land | Improvement |
|---|---|---|---|---|
| 2025 | $5,158 | $425,900 | $134,400 | $291,500 |
| 2024 | $5,024 | $418,000 | $134,400 | $283,600 |
| 2023 | $4,853 | $373,900 | $101,000 | $272,900 |
| 2022 | $4,621 | $330,800 | $91,500 | $239,300 |
| 2021 | $0 | $286,500 | $75,500 | $211,000 |
| 2020 | $4,244 | $280,100 | $71,400 | $208,700 |
| 2019 | $3,857 | $248,200 | $68,700 | $179,500 |
| 2018 | $0 | $229,600 | $68,700 | $160,900 |
| 2017 | $3,177 | $197,300 | $68,700 | $128,600 |
| 2016 | $3,267 | $188,200 | $66,500 | $121,700 |
| 2015 | $2,931 | $161,500 | $66,500 | $95,000 |
| 2014 | $2,930 | $161,600 | $66,500 | $95,100 |
Source: Public Records
Map
Nearby Homes
- 49 S Fuller St
- 59 S Fuller St Extension
- 132 Dover St
- 120 Dover St Unit 1W
- 120 Dover St
- 140 Dover St
- 65 S Fuller St
- 65 S Fuller Street Extension
- 114 Dover St
- 144 Dover St
- 73 Foster St
- 62 S Fuller St Extension
- 62 S Fuller St
- 62 S Fuller St
- 66 S Fuller St
- 110 Dover St
- 71 S Fuller St
- 70 S Fuller St
- 70 S Fuller St Unit 3
- 33 Johnson Square