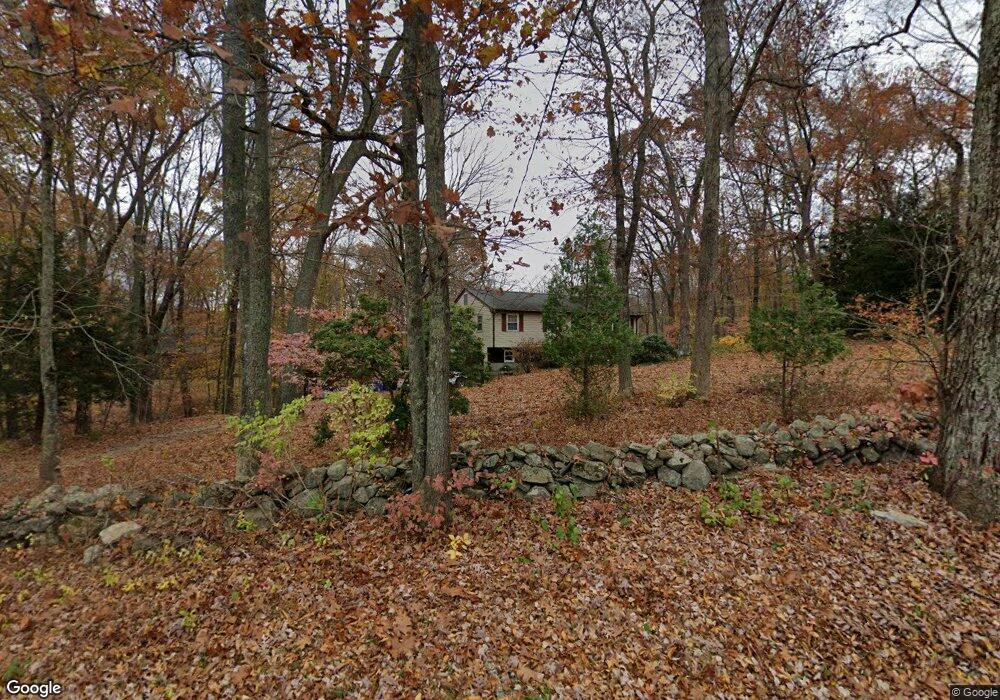
55 Sillimanville Rd East Hampton, CT 06424
Estimated Value: $363,006 - $395,000
3
Beds
2
Baths
1,132
Sq Ft
$331/Sq Ft
Est. Value
About This Home
This home is located at 55 Sillimanville Rd, East Hampton, CT 06424 and is currently estimated at $374,502, approximately $330 per square foot. 55 Sillimanville Rd is a home located in Middlesex County with nearby schools including Memorial School, Center Elementary School, and East Hampton Middle School.
Ownership History
Date
Name
Owned For
Owner Type
Purchase Details
Closed on
Dec 22, 2011
Sold by
Zorn Stanley and Heimrath Irene
Bought by
Shepherd Ronald L and Shepherd Margaret
Current Estimated Value
Home Financials for this Owner
Home Financials are based on the most recent Mortgage that was taken out on this home.
Original Mortgage
$175,920
Outstanding Balance
$120,226
Interest Rate
3.99%
Estimated Equity
$254,276
Purchase Details
Closed on
Feb 29, 2000
Sold by
Johnson Gary A and Johnson Laura J
Bought by
Heimrath Irene
Home Financials for this Owner
Home Financials are based on the most recent Mortgage that was taken out on this home.
Original Mortgage
$50,000
Interest Rate
8.15%
Purchase Details
Closed on
Nov 1, 1995
Sold by
Mesawich John C and Kepner Anne D
Bought by
Johnson Gary A and Johnson Laura J
Create a Home Valuation Report for This Property
The Home Valuation Report is an in-depth analysis detailing your home's value as well as a comparison with similar homes in the area
Home Values in the Area
Average Home Value in this Area
Purchase History
| Date | Buyer | Sale Price | Title Company |
|---|---|---|---|
| Shepherd Ronald L | $219,900 | -- | |
| Shepherd Ronald L | $219,900 | -- | |
| Heimrath Irene | $155,000 | -- | |
| Heimrath Irene | $155,000 | -- | |
| Johnson Gary A | $123,500 | -- | |
| Johnson Gary A | $123,500 | -- |
Source: Public Records
Mortgage History
| Date | Status | Borrower | Loan Amount |
|---|---|---|---|
| Open | Shepherd Ronald L | $175,920 | |
| Closed | Johnson Gary A | $175,920 | |
| Previous Owner | Johnson Gary A | $50,000 |
Source: Public Records
Tax History Compared to Growth
Tax History
| Year | Tax Paid | Tax Assessment Tax Assessment Total Assessment is a certain percentage of the fair market value that is determined by local assessors to be the total taxable value of land and additions on the property. | Land | Improvement |
|---|---|---|---|---|
| 2025 | $6,372 | $160,470 | $65,850 | $94,620 |
| 2024 | $6,104 | $160,470 | $65,850 | $94,620 |
| 2023 | $5,787 | $160,470 | $65,850 | $94,620 |
| 2022 | $5,562 | $160,470 | $65,850 | $94,620 |
| 2021 | $5,541 | $160,470 | $65,850 | $94,620 |
| 2020 | $5,075 | $153,140 | $67,100 | $86,040 |
| 2019 | $5,123 | $154,580 | $68,980 | $85,600 |
| 2018 | $4,841 | $154,580 | $68,980 | $85,600 |
| 2017 | $4,841 | $154,580 | $68,980 | $85,600 |
| 2016 | $4,551 | $154,580 | $68,980 | $85,600 |
| 2015 | $4,438 | $159,770 | $70,250 | $89,520 |
| 2014 | $3,862 | $159,770 | $70,250 | $89,520 |
Source: Public Records
Map
Nearby Homes
- 213 Waterhole Rd
- 115 Sillimanville Rd
- 154 Falls Rd
- 92 Cherry Swamp Rd
- 115 Lakeview Dr
- 145 Lakeview Dr
- 53 Falls Rd
- 71 Cherry Swamp Rd
- 53 Falls Bashan Rd
- 8 Augusta Cir Unit 8
- 67 Pickerel Lake Rd
- 42 Dogwood Rd
- 597 Westchester Rd
- 10 Cherry Swamp Rd
- 398 E Haddam Moodus Rd
- 67 Moodus Leesville Rd
- 5 Joe Williams Rd
- 8 Tom Rd
- 119 Colchester Ave
- 21 Olmstead Rd
- 57 Sillimanville Rd
- 53 Sillimanville Rd
- 67 Sillimanville Rd
- 61 Sillimanville Rd
- 63 Sillimanville Rd
- 69 Sillimanville Rd
- 68 Sillimanville Rd
- 49 Sillimanville Rd
- 11 Brookside Ct
- 71 Sillimanville Rd
- 70 Sillimanville Rd
- 15 Brookside Ct
- 73 Sillimanville Rd
- 72 Sillimanville Rd
- 19 Brookside Ct
- 7 Brookside Ct
- 5 Brookside Ct
- 77 Sillimanville Rd
- 76 Sillimanville Rd
- 4 Brookside Ct