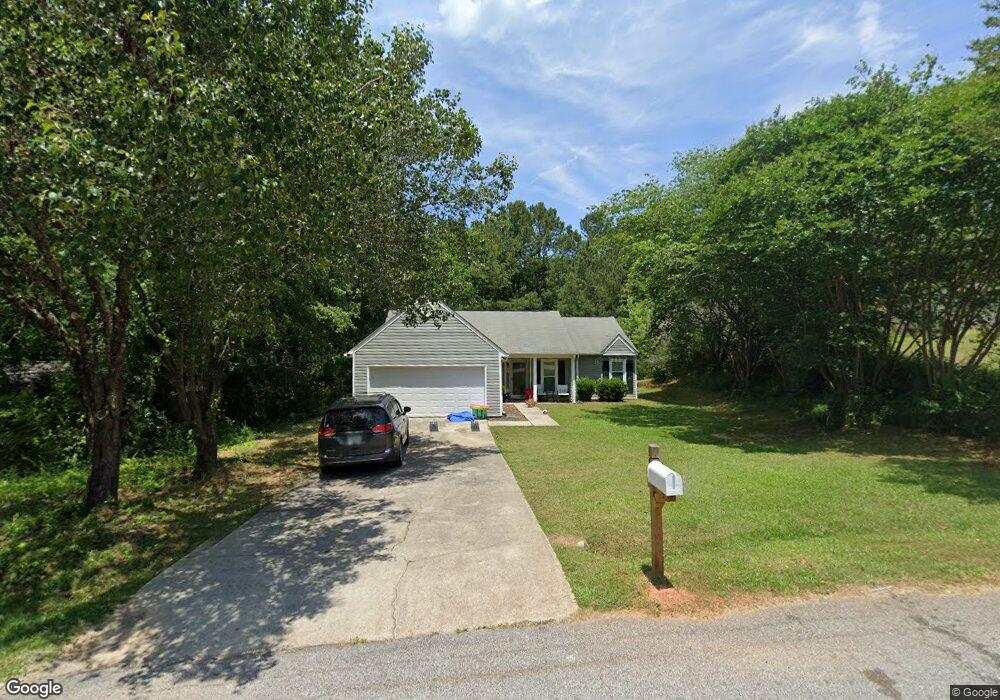
55 Spring Cir Senoia, GA 30276
Estimated Value: $294,962 - $332,000
3
Beds
2
Baths
1,281
Sq Ft
$242/Sq Ft
Est. Value
About This Home
This home is located at 55 Spring Cir, Senoia, GA 30276 and is currently estimated at $310,491, approximately $242 per square foot. 55 Spring Cir is a home located in Coweta County with nearby schools including Willis Road Elementary School, East Coweta Middle School, and East Coweta High School.
Ownership History
Date
Name
Owned For
Owner Type
Purchase Details
Closed on
Jun 18, 2021
Sold by
Fuzzy Bee Properties Llc
Bought by
Brawner Wesley D and Brawner Courtney
Current Estimated Value
Home Financials for this Owner
Home Financials are based on the most recent Mortgage that was taken out on this home.
Original Mortgage
$215,033
Outstanding Balance
$194,261
Interest Rate
2.9%
Mortgage Type
FHA
Estimated Equity
$116,230
Purchase Details
Closed on
Jul 15, 2014
Sold by
Macmacnoble Timothy Mac
Bought by
Fuzzy Bee Properties Llc
Purchase Details
Closed on
Apr 5, 2011
Sold by
Noble Wahna Dresden
Bought by
Macmacnoble Timothy Mac
Purchase Details
Closed on
Nov 16, 2010
Sold by
Noble Wahna Dresden
Bought by
Macmacnoble Timothy Mac
Purchase Details
Closed on
Oct 21, 1994
Bought by
Noble Wahna Dresden
Purchase Details
Closed on
Jun 8, 1989
Bought by
Bond David A and Bond Susan
Create a Home Valuation Report for This Property
The Home Valuation Report is an in-depth analysis detailing your home's value as well as a comparison with similar homes in the area
Home Values in the Area
Average Home Value in this Area
Purchase History
| Date | Buyer | Sale Price | Title Company |
|---|---|---|---|
| Brawner Wesley D | $219,000 | -- | |
| Fuzzy Bee Properties Llc | $65,000 | -- | |
| Macmacnoble Timothy Mac | -- | -- | |
| Macmacnoble Timothy Mac | -- | -- | |
| Noble Wahna Dresden | $71,900 | -- | |
| Bond David A | $65,800 | -- |
Source: Public Records
Mortgage History
| Date | Status | Borrower | Loan Amount |
|---|---|---|---|
| Open | Brawner Wesley D | $215,033 |
Source: Public Records
Tax History Compared to Growth
Tax History
| Year | Tax Paid | Tax Assessment Tax Assessment Total Assessment is a certain percentage of the fair market value that is determined by local assessors to be the total taxable value of land and additions on the property. | Land | Improvement |
|---|---|---|---|---|
| 2025 | $2,717 | $100,616 | $22,000 | $78,616 |
| 2024 | $2,645 | $98,994 | $22,000 | $76,994 |
| 2023 | $2,645 | $83,560 | $20,000 | $63,560 |
| 2022 | $2,217 | $79,840 | $20,000 | $59,840 |
| 2021 | $1,895 | $59,816 | $20,000 | $39,816 |
| 2020 | $1,680 | $52,053 | $20,000 | $32,053 |
| 2019 | $1,586 | $44,383 | $10,000 | $34,383 |
| 2018 | $1,594 | $44,383 | $10,000 | $34,383 |
| 2017 | $1,556 | $43,110 | $10,000 | $33,110 |
| 2016 | $1,344 | $37,289 | $8,000 | $29,289 |
| 2015 | $923 | $31,941 | $8,000 | $23,941 |
| 2014 | $1,100 | $31,042 | $8,000 | $23,042 |
Source: Public Records
Map
Nearby Homes
- 416 Rockaway Rd
- 42 Piedmont Dr
- 315 Emerald Way
- 631 Rockaway Rd
- 140 Southridge
- 305 Traditions Way
- 933 Stallings Rd
- 0 Coweta St Unit 10555038
- 35 Millwalk Dr
- 245 South Ridge
- 290 South Ridge
- 49 Standing Rock Rd
- 367 Northridge Dr
- 316 Hammerstone Ct
- 170 Redhaven Dr
- 215 Redhaven Dr
- 65 Redhaven Dr
- 390 Redhaven Dr
- 99 Middle St Unit lot 8
- 130 Redhaven Dr
- 65 Spring Cir
- 45 Spring Cir
- 10 Ridge Dr
- 0 Ridge Dr Unit Lot 49
- 0 Ridge Dr Unit 8827025
- 0 Ridge Dr Unit 3148949
- 0 Ridge Dr Unit 7244038
- 0 Ridge Dr Unit 7407617
- 0 Ridge Dr Unit 7552964
- 0 Ridge Dr Unit 8408076
- 0 Ridge Dr Unit 8508761
- 0 Ridge Dr Unit 8550200
- 71 Spring Cir
- 20 Ridge Dr
- 97 Tracy Ct Unit CREEK
- 50 Spring Cir
- 89 Tracy Ct Unit CREEK
- 77 Tracy Ct Unit CREEK
- 85 Spring Cir
- 15 Ridge Dr