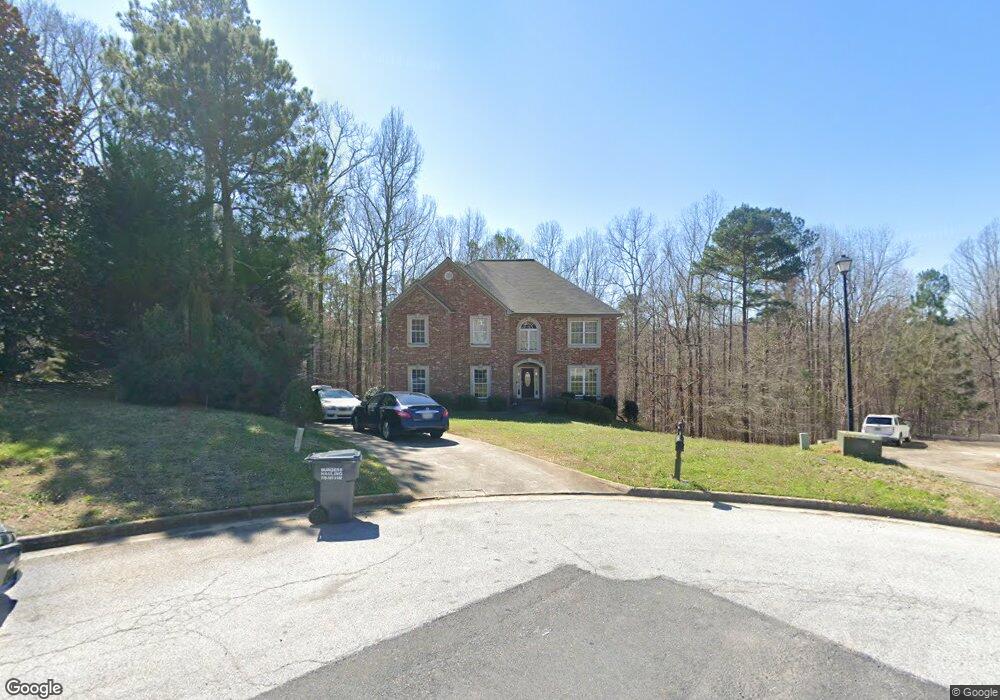
55 Thornberry Way Covington, GA 30016
Estimated Value: $392,000 - $503,000
6
Beds
4
Baths
4,186
Sq Ft
$108/Sq Ft
Est. Value
About This Home
This home is located at 55 Thornberry Way, Covington, GA 30016 and is currently estimated at $451,853, approximately $107 per square foot. 55 Thornberry Way is a home located in Newton County with nearby schools including Oak Hill Elementary School, Veterans Memorial Middle School, and Alcovy High School.
Ownership History
Date
Name
Owned For
Owner Type
Purchase Details
Closed on
Oct 3, 2017
Sold by
Federal Natl Mtg Assn
Bought by
Simpton Chartes T and Owens Marcus
Current Estimated Value
Home Financials for this Owner
Home Financials are based on the most recent Mortgage that was taken out on this home.
Original Mortgage
$240,463
Outstanding Balance
$209,219
Interest Rate
5.5%
Mortgage Type
FHA
Estimated Equity
$242,634
Purchase Details
Closed on
Jun 22, 2017
Sold by
Nationstar Mtg Llc
Bought by
Federal National Mtg Associati
Purchase Details
Closed on
Jun 6, 2017
Sold by
Johnson George
Bought by
Nationstar Mtg Llc
Purchase Details
Closed on
Mar 28, 2005
Sold by
Bonner Bldrs Inc
Bought by
Taylor Blt Const Inc
Home Financials for this Owner
Home Financials are based on the most recent Mortgage that was taken out on this home.
Original Mortgage
$401,200
Interest Rate
5.57%
Create a Home Valuation Report for This Property
The Home Valuation Report is an in-depth analysis detailing your home's value as well as a comparison with similar homes in the area
Home Values in the Area
Average Home Value in this Area
Purchase History
| Date | Buyer | Sale Price | Title Company |
|---|---|---|---|
| Simpton Chartes T | $244,900 | -- | |
| Federal National Mtg Associati | $229,429 | -- | |
| Nationstar Mtg Llc | $229,429 | -- | |
| Taylor Blt Const Inc | $88,000 | -- |
Source: Public Records
Mortgage History
| Date | Status | Borrower | Loan Amount |
|---|---|---|---|
| Open | Simpton Chartes T | $240,463 | |
| Previous Owner | Taylor Blt Const Inc | $401,200 |
Source: Public Records
Tax History Compared to Growth
Tax History
| Year | Tax Paid | Tax Assessment Tax Assessment Total Assessment is a certain percentage of the fair market value that is determined by local assessors to be the total taxable value of land and additions on the property. | Land | Improvement |
|---|---|---|---|---|
| 2024 | $4,130 | $164,520 | $23,600 | $140,920 |
| 2023 | $4,674 | $173,920 | $22,000 | $151,920 |
| 2022 | $3,755 | $140,040 | $11,600 | $128,440 |
| 2021 | $3,350 | $112,360 | $11,600 | $100,760 |
| 2020 | $3,437 | $104,480 | $11,600 | $92,880 |
| 2019 | $3,372 | $101,040 | $11,600 | $89,440 |
| 2018 | $3,394 | $97,160 | $11,600 | $85,560 |
| 2017 | $1,987 | $85,400 | $11,600 | $73,800 |
| 2016 | $1,979 | $85,160 | $10,000 | $75,160 |
| 2015 | $1,728 | $78,000 | $7,000 | $71,000 |
| 2014 | $1,346 | $67,080 | $0 | $0 |
Source: Public Records
Map
Nearby Homes
- 20 Tarpley Way
- 145 Providence Dr
- 45 Saratoga Way
- 1695 Butler Bridge Rd
- 175 Cambridge Way Unit 2
- 190 the Falls Blvd
- 35 Cambridge Way
- 55 the Falls Blvd
- 20 Clarion Ct
- 20 N River Rd
- 50 Butler Bridge Cir
- 435 Butler Bridge Cir
- 195 Sampson Ct
- 31 Butler Bridge Dr
- 110 Thomas Trail
- 60 Parkman Trail
- 40 Mildred Ln
- 0 Goldfinch Dr
- 0 Goldfinch Dr Unit 7564125
- 45 Thornberry Way
- 60 Thornberry Way
- 35 Thornberry Way
- 40 Thornberry Way
- 50 Thornberry Way
- 20 Thornberry Way
- 25 Thornberry Way Unit 70
- 25 Thornberry Way
- 0 Thornberry Way Unit 8892724
- 0 Thornberry Way
- 45 Silverton Dr Unit 59
- 35 Silverton Dr
- 55 Silverton Dr
- 25 Providence Dr
- 35 Providence Dr
- 234 Silver Willow
- 25 Silverton Dr
- 45 Providence Dr
- 60 Silverton Dr
- 140 Silverton Dr