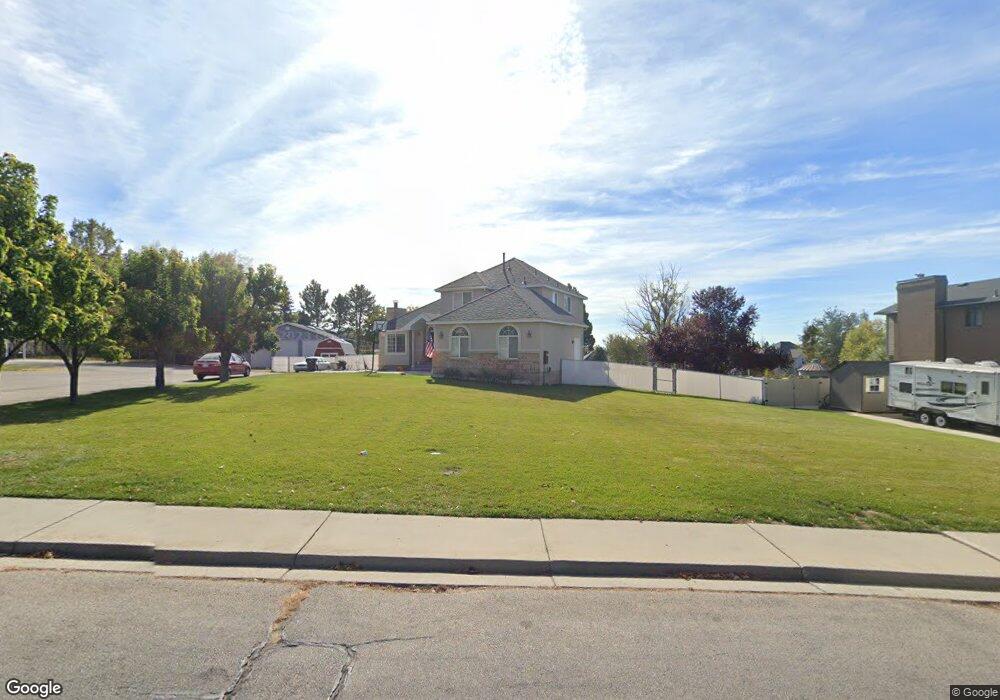
55 W 725 N Lindon, UT 84042
Estimated Value: $626,000 - $833,024
3
Beds
3
Baths
2,007
Sq Ft
$365/Sq Ft
Est. Value
About This Home
This home is located at 55 W 725 N, Lindon, UT 84042 and is currently estimated at $733,341, approximately $365 per square foot. 55 W 725 N is a home located in Utah County with nearby schools including Lindon Elementary School, Oak Canyon Junior High School, and Pleasant Grove High School.
Ownership History
Date
Name
Owned For
Owner Type
Purchase Details
Closed on
Feb 24, 2005
Sold by
Fenton Timothy and Fenton Karen
Bought by
Fenton Timothy R and Fenton Karen
Current Estimated Value
Home Financials for this Owner
Home Financials are based on the most recent Mortgage that was taken out on this home.
Original Mortgage
$240,052
Outstanding Balance
$122,103
Interest Rate
5.66%
Mortgage Type
VA
Estimated Equity
$611,238
Purchase Details
Closed on
Jun 5, 2000
Sold by
Fenton Timothy R and Fenton Karen
Bought by
Fenton Timothy and Fenton Karen
Create a Home Valuation Report for This Property
The Home Valuation Report is an in-depth analysis detailing your home's value as well as a comparison with similar homes in the area
Home Values in the Area
Average Home Value in this Area
Purchase History
| Date | Buyer | Sale Price | Title Company |
|---|---|---|---|
| Fenton Timothy R | -- | Utah First Title Insurance | |
| Hulsey Damon M | -- | Utah First Title Insurance | |
| Fenton Timothy | -- | Mountain West Title Co |
Source: Public Records
Mortgage History
| Date | Status | Borrower | Loan Amount |
|---|---|---|---|
| Open | Hulsey Damon M | $240,052 | |
| Closed | Fenton Timothy R | $240,052 |
Source: Public Records
Tax History
| Year | Tax Paid | Tax Assessment Tax Assessment Total Assessment is a certain percentage of the fair market value that is determined by local assessors to be the total taxable value of land and additions on the property. | Land | Improvement |
|---|---|---|---|---|
| 2025 | $3,188 | $420,090 | -- | -- |
| 2024 | $3,188 | $393,030 | $0 | $0 |
| 2023 | $2,967 | $392,865 | $0 | $0 |
| 2022 | $3,057 | $391,050 | $0 | $0 |
| 2021 | $2,527 | $487,400 | $306,200 | $181,200 |
| 2020 | $2,384 | $452,600 | $278,400 | $174,200 |
| 2019 | $2,027 | $401,600 | $227,400 | $174,200 |
| 2018 | $1,973 | $368,400 | $199,500 | $168,900 |
| 2017 | $1,949 | $195,195 | $0 | $0 |
| 2016 | $1,923 | $178,090 | $0 | $0 |
| 2015 | $1,918 | $167,970 | $0 | $0 |
| 2014 | $1,621 | $140,635 | $0 | $0 |
Source: Public Records
Map
Nearby Homes
Your Personal Tour Guide
Ask me questions while you tour the home.