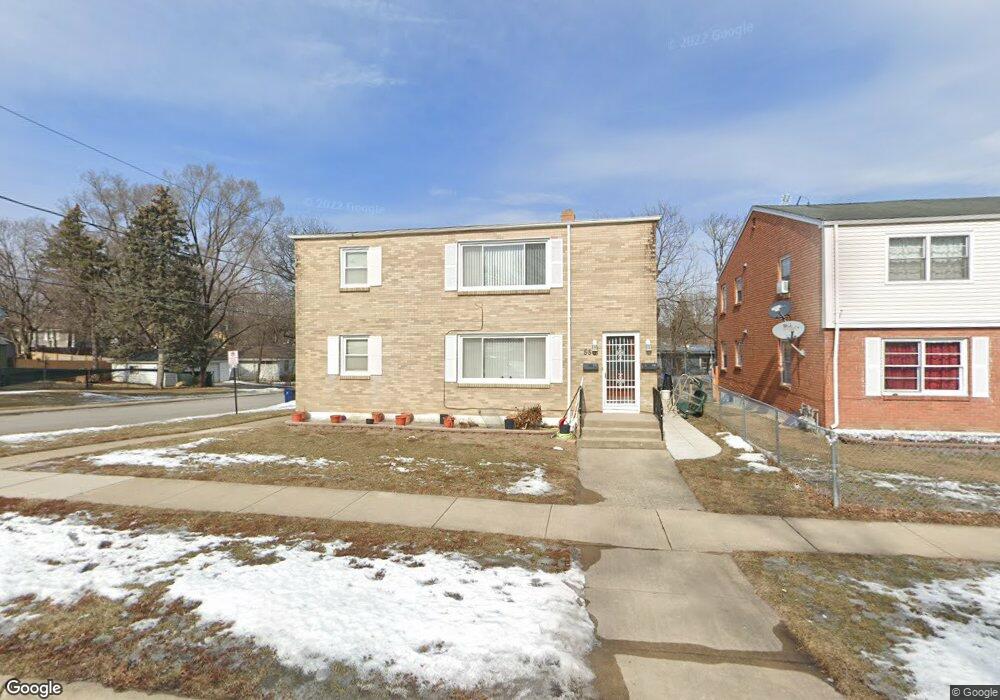
550 Barrett St Elgin, IL 60120
Gifford Park NeighborhoodEstimated Value: $329,000 - $413,000
4
Beds
3
Baths
2,592
Sq Ft
$141/Sq Ft
Est. Value
About This Home
This home is located at 550 Barrett St, Elgin, IL 60120 and is currently estimated at $365,008, approximately $140 per square foot. 550 Barrett St is a home located in Kane County with nearby schools including Huff Elementary School, Ellis Middle School, and Elgin High School.
Ownership History
Date
Name
Owned For
Owner Type
Purchase Details
Closed on
May 27, 2004
Sold by
Keophilalay Bounmy and Sichampanakhone Khamphone
Bought by
Keophilalay Bounmy and Keophilalay Khamphone
Current Estimated Value
Home Financials for this Owner
Home Financials are based on the most recent Mortgage that was taken out on this home.
Original Mortgage
$152,000
Interest Rate
5.99%
Mortgage Type
Stand Alone Refi Refinance Of Original Loan
Purchase Details
Closed on
Jan 2, 2001
Sold by
Phothisene Tia and Phothisene Leuang
Bought by
Keophilalay Bounmy and Sichampanakhone Khamphone
Home Financials for this Owner
Home Financials are based on the most recent Mortgage that was taken out on this home.
Original Mortgage
$137,000
Interest Rate
7.22%
Mortgage Type
Purchase Money Mortgage
Purchase Details
Closed on
Jun 30, 1997
Sold by
Ramangkoun Khemphet
Bought by
Khone Khamphone Suchampana and Kene Tia Photh
Home Financials for this Owner
Home Financials are based on the most recent Mortgage that was taken out on this home.
Original Mortgage
$136,432
Interest Rate
8%
Mortgage Type
FHA
Create a Home Valuation Report for This Property
The Home Valuation Report is an in-depth analysis detailing your home's value as well as a comparison with similar homes in the area
Home Values in the Area
Average Home Value in this Area
Purchase History
| Date | Buyer | Sale Price | Title Company |
|---|---|---|---|
| Keophilalay Bounmy | -- | Residential Title Services | |
| Keophilalay Bounmy | -- | Ticor Title Insurance | |
| Khone Khamphone Suchampana | $139,000 | -- |
Source: Public Records
Mortgage History
| Date | Status | Borrower | Loan Amount |
|---|---|---|---|
| Closed | Keophilalay Bounmy | $152,000 | |
| Closed | Keophilalay Bounmy | $137,000 | |
| Previous Owner | Khone Khamphone Suchampana | $136,432 |
Source: Public Records
Tax History
| Year | Tax Paid | Tax Assessment Tax Assessment Total Assessment is a certain percentage of the fair market value that is determined by local assessors to be the total taxable value of land and additions on the property. | Land | Improvement |
|---|---|---|---|---|
| 2024 | $6,143 | $92,762 | $14,090 | $78,672 |
| 2023 | $5,780 | $83,803 | $12,729 | $71,074 |
| 2022 | $5,161 | $70,522 | $11,607 | $58,915 |
| 2021 | $4,368 | $65,933 | $10,852 | $55,081 |
| 2020 | $4,465 | $62,943 | $10,360 | $52,583 |
| 2019 | $4,573 | $59,958 | $9,869 | $50,089 |
| 2018 | $4,497 | $56,484 | $9,297 | $47,187 |
| 2017 | $4,361 | $53,398 | $8,789 | $44,609 |
| 2016 | $4,644 | $49,539 | $8,154 | $41,385 |
| 2015 | -- | $45,407 | $7,474 | $37,933 |
| 2014 | -- | $44,847 | $7,382 | $37,465 |
| 2013 | -- | $46,030 | $7,577 | $38,453 |
Source: Public Records
Map
Nearby Homes
- 450 Villa St
- 483 Barrett St
- 332-334 St Charles St
- 286 Villa St
- 457 Arlington Ave
- 262 Bartlett Place
- 277 Gifford Place
- 631 Bent St
- 518 Raymond St
- 689 Bent St
- 513 Cookane Ave
- 115 N Porter St
- 162 Festival Ct
- 211 Prairie St
- 131 N Gifford St
- 216 Prairie St
- 445 Lucile Ave
- 7 National St Unit 7
- 3 National St Unit 3
- 453 Addison St
- 554 Barrett St
- 529 Levine Ct Unit 31
- 560 Barrett St
- 520 Barrett St
- 530 Levine Ct Unit 32
- 564 Barrett St Unit 66
- 516 Barrett St
- 551 Levine Ct Unit 53
- 236 Healy St
- 302 Healy St
- 301 Healy St Unit 303
- 570 Barrett St
- 559 Barrett St
- 510 Barrett St
- 550 Levine Ct Unit 52
- 227 Healy St
- 563 Barrett St
- 535 Stella Ct
- 567 Barrett St
- 230 Healy St
Your Personal Tour Guide
Ask me questions while you tour the home.