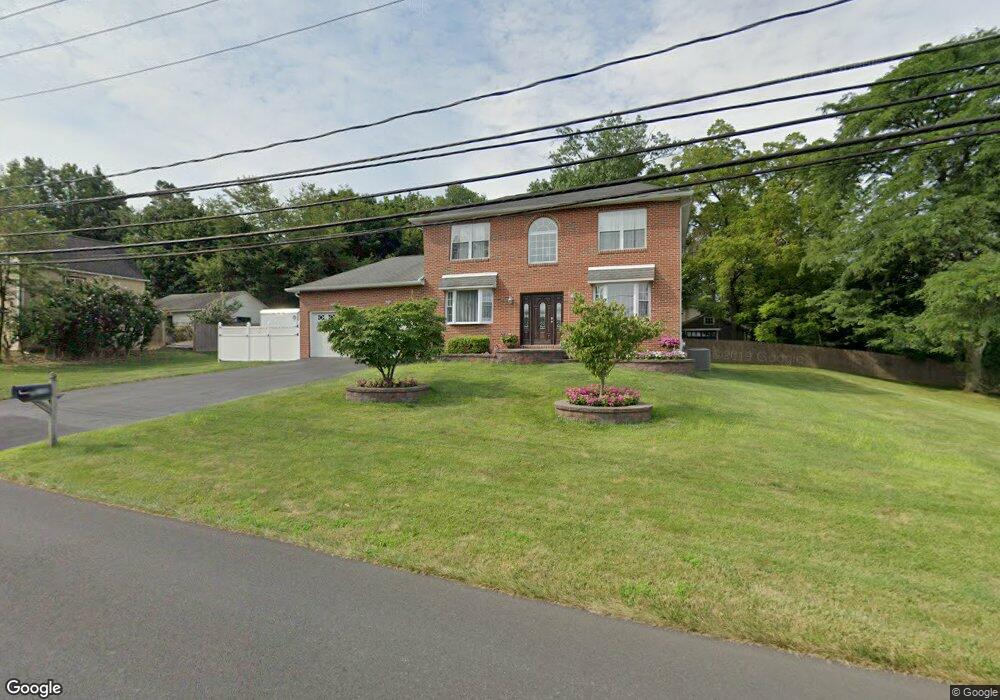
550 Hampton Ave Southampton, PA 18966
Estimated Value: $671,000 - $858,000
4
Beds
3
Baths
2,508
Sq Ft
$293/Sq Ft
Est. Value
About This Home
This home is located at 550 Hampton Ave, Southampton, PA 18966 and is currently estimated at $734,618, approximately $292 per square foot. 550 Hampton Ave is a home located in Bucks County with nearby schools including Davis Elementary School, Klinger Middle School, and William Tennent High School.
Ownership History
Date
Name
Owned For
Owner Type
Purchase Details
Closed on
Jan 12, 2024
Sold by
Hammitt Philip C and Hammitt Patricia J
Bought by
Hammitt Philip C and Hammitt Patricia J
Current Estimated Value
Purchase Details
Closed on
Jul 16, 1999
Sold by
Toner Robert
Bought by
Hammitt Phillip C and Jones Boyd Patricia
Home Financials for this Owner
Home Financials are based on the most recent Mortgage that was taken out on this home.
Original Mortgage
$175,000
Interest Rate
7.49%
Purchase Details
Closed on
Jan 21, 1999
Sold by
Laing William Dale and Laing Lois Dawn
Bought by
Toner Robert
Home Financials for this Owner
Home Financials are based on the most recent Mortgage that was taken out on this home.
Original Mortgage
$68,500
Interest Rate
6.67%
Mortgage Type
Seller Take Back
Create a Home Valuation Report for This Property
The Home Valuation Report is an in-depth analysis detailing your home's value as well as a comparison with similar homes in the area
Home Values in the Area
Average Home Value in this Area
Purchase History
| Date | Buyer | Sale Price | Title Company |
|---|---|---|---|
| Hammitt Philip C | -- | None Listed On Document | |
| Hammitt Phillip C | $243,900 | -- | |
| Toner Robert | $104,000 | -- |
Source: Public Records
Mortgage History
| Date | Status | Borrower | Loan Amount |
|---|---|---|---|
| Previous Owner | Hammitt Phillip C | $175,000 | |
| Previous Owner | Toner Robert | $68,500 |
Source: Public Records
Tax History Compared to Growth
Tax History
| Year | Tax Paid | Tax Assessment Tax Assessment Total Assessment is a certain percentage of the fair market value that is determined by local assessors to be the total taxable value of land and additions on the property. | Land | Improvement |
|---|---|---|---|---|
| 2025 | $8,808 | $41,180 | $7,880 | $33,300 |
| 2024 | $8,808 | $41,180 | $7,880 | $33,300 |
| 2023 | $8,540 | $41,180 | $7,880 | $33,300 |
| 2022 | $8,360 | $41,180 | $7,880 | $33,300 |
| 2021 | $8,209 | $41,180 | $7,880 | $33,300 |
| 2020 | $8,096 | $41,180 | $7,880 | $33,300 |
| 2019 | $8,506 | $44,920 | $7,880 | $37,040 |
| 2018 | $8,310 | $44,920 | $7,880 | $37,040 |
| 2017 | $8,075 | $44,920 | $7,880 | $37,040 |
| 2016 | $8,075 | $44,920 | $7,880 | $37,040 |
| 2015 | -- | $44,920 | $7,880 | $37,040 |
| 2014 | -- | $44,920 | $7,880 | $37,040 |
Source: Public Records
Map
Nearby Homes
- 615 Belmont Ave
- 206 E Hampton Crossing
- 19 Belmont Station
- 561 Zinn Dr
- 634 Nicole Dr
- 415 New Rd
- 909 Carlin Dr
- 419 Temple Rd
- 736 Plum St
- 926 Carlin Dr
- 435 Temple Rd
- 530 Andrew Dr
- 325 Toll Dr
- 1307 Steamboat Station Unit 1307
- 756 Churchville Rd
- 603 Steamboat Station Unit 603
- 967 Jeffrey Dr
- 604 Cushmore Rd
- 1081 Cherry Ln
- 117 Maple Ave
- 549 Belmont Ave
- 540 Hampton Ave
- 541 Belmont Ave
- 624 Summit Ave
- 620 Summit Ave
- 634 Summit Ave
- 563 Belmont Ave
- 640 Summit Ave
- 598 Hampton Ave Unit F
- 539 Belmont Ave
- 604 Hampton Ave
- 542 Street Rd
- 548 Street Rd
- 548 Street Rd Unit 1
- 605 Belmont Ave
- 603 Hampton Ave
- 538 Street Rd Unit STRG 2
- 538 Street Rd Unit STRG 1
- 538 Street Rd
- 538 Street Rd Unit 700-1