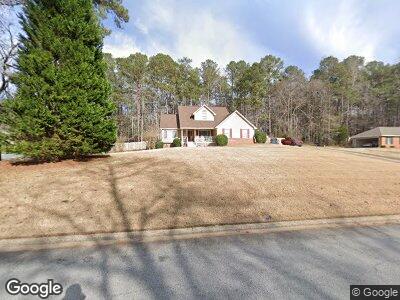
550 Mapledale Trail Unit VII Sharpsburg, GA 30277
Estimated Value: $412,900 - $449,000
3
Beds
3
Baths
2,654
Sq Ft
$163/Sq Ft
Est. Value
About This Home
This home is located at 550 Mapledale Trail Unit VII, Sharpsburg, GA 30277 and is currently estimated at $432,975, approximately $163 per square foot. 550 Mapledale Trail Unit VII is a home located in Coweta County with nearby schools including Thomas Crossroads Elementary School, Lee Middle School, and Northgate High School.
Ownership History
Date
Name
Owned For
Owner Type
Purchase Details
Closed on
Jul 30, 1998
Sold by
Cutter Leonard O
Bought by
Johnson Lacy M and Johnson Christine O
Current Estimated Value
Home Financials for this Owner
Home Financials are based on the most recent Mortgage that was taken out on this home.
Original Mortgage
$90,000
Interest Rate
6.97%
Mortgage Type
New Conventional
Purchase Details
Closed on
May 19, 1997
Sold by
Barthlow Karlin K and Barthlow Helen E
Bought by
Cutter Leonard O
Home Financials for this Owner
Home Financials are based on the most recent Mortgage that was taken out on this home.
Original Mortgage
$130,875
Interest Rate
8.17%
Mortgage Type
New Conventional
Purchase Details
Closed on
Jun 27, 1991
Bought by
Barthlow Karlan Kim
Purchase Details
Closed on
Feb 20, 1991
Bought by
Brown Richard F
Create a Home Valuation Report for This Property
The Home Valuation Report is an in-depth analysis detailing your home's value as well as a comparison with similar homes in the area
Home Values in the Area
Average Home Value in this Area
Purchase History
| Date | Buyer | Sale Price | Title Company |
|---|---|---|---|
| Johnson Lacy M | $180,000 | -- | |
| Cutter Leonard O | $174,500 | -- | |
| Barthlow Karlan Kim | $154,000 | -- | |
| Brown Richard F | $17,700 | -- |
Source: Public Records
Mortgage History
| Date | Status | Borrower | Loan Amount |
|---|---|---|---|
| Open | Johnson Lacy M | $394,419 | |
| Closed | Johnson Lacy M | $268,737 | |
| Closed | Johnson Lacy M | $263,890 | |
| Closed | Johnson Lacy M | $219,753 | |
| Closed | Johnson Lacy M | $165,366 | |
| Closed | Johnson Lacy M | $159,082 | |
| Closed | Johnson Lacy M | $110,805 | |
| Closed | Johnson Lacy M | $109,300 | |
| Closed | Johnson Lacy M | $71,227 | |
| Closed | Johnson Lacy M | $90,000 | |
| Previous Owner | Cutter Leonard O | $130,875 |
Source: Public Records
Tax History Compared to Growth
Tax History
| Year | Tax Paid | Tax Assessment Tax Assessment Total Assessment is a certain percentage of the fair market value that is determined by local assessors to be the total taxable value of land and additions on the property. | Land | Improvement |
|---|---|---|---|---|
| 2023 | $1,828 | $149,454 | $26,000 | $123,454 |
| 2022 | $1,295 | $130,646 | $26,000 | $104,646 |
| 2021 | $1,101 | $100,535 | $18,000 | $82,535 |
| 2020 | $1,103 | $100,535 | $18,000 | $82,535 |
| 2019 | $1,636 | $97,536 | $16,000 | $81,536 |
| 2018 | $1,641 | $97,536 | $16,000 | $81,536 |
| 2017 | $1,920 | $94,368 | $16,000 | $78,368 |
| 2016 | $1,633 | $85,498 | $16,000 | $69,498 |
| 2015 | $1,322 | $75,994 | $16,000 | $59,994 |
| 2014 | $1,161 | $70,994 | $11,000 | $59,994 |
Source: Public Records
Map
Nearby Homes
- 180 Willow Lake Ln
- 230 Mapledale Trail
- 225 Mapledale Trail
- 114 Delta Ct
- 90 Hazelridge Ln
- 0 E Plantation Dr Unit 10398996
- 757 Fischer Rd
- 175 Thomas Overby Dr
- 45 Highland Park Way
- 2940 Highway 54
- 374 Beaumont Farms Dr
- 20 Platinum Ridge
- 0 Spring Forest Way Unit LOT 2-1 10483749
- 704 Pine Grove Cir
- 0 Highway 54 Unit 10480699
- 0 Highway 54 Unit 10139299
- 00 Highway 54
- 0 Highway 54 Unit 7182931
- 0 Highway 54 Unit 10135435
- 102 Beaver Dam Rd
- 550 Mapledale Trail Unit VII
- 540 Mapledale Trail
- 560 Mapledale Trail
- 530 Mapledale Trail
- 130 Laurel Ln
- 565 Mapledale Trail
- 555 Mapledale Trail
- 140 Laurel Ln
- 545 Mapledale Trail
- 140 Laurel Ln Unit LOT 140
- 160 Oakcrest Dr
- 170 Oakcrest Dr
- 170 Oakcrest Dr Unit 2
- 520 Mapledale Trail
- 535 Mapledale Trail
- 45 Elmtree Dr Unit 8
- 150 Oakcrest Dr
- 120 Laurel Ln
- 35 Elmtree Dr Unit VIII
- 0 Bay Laurel Dr Unit LOT 136 03167662