Estimated Value: $350,000 - $482,000
5
Beds
3
Baths
2,394
Sq Ft
$176/Sq Ft
Est. Value
About This Home
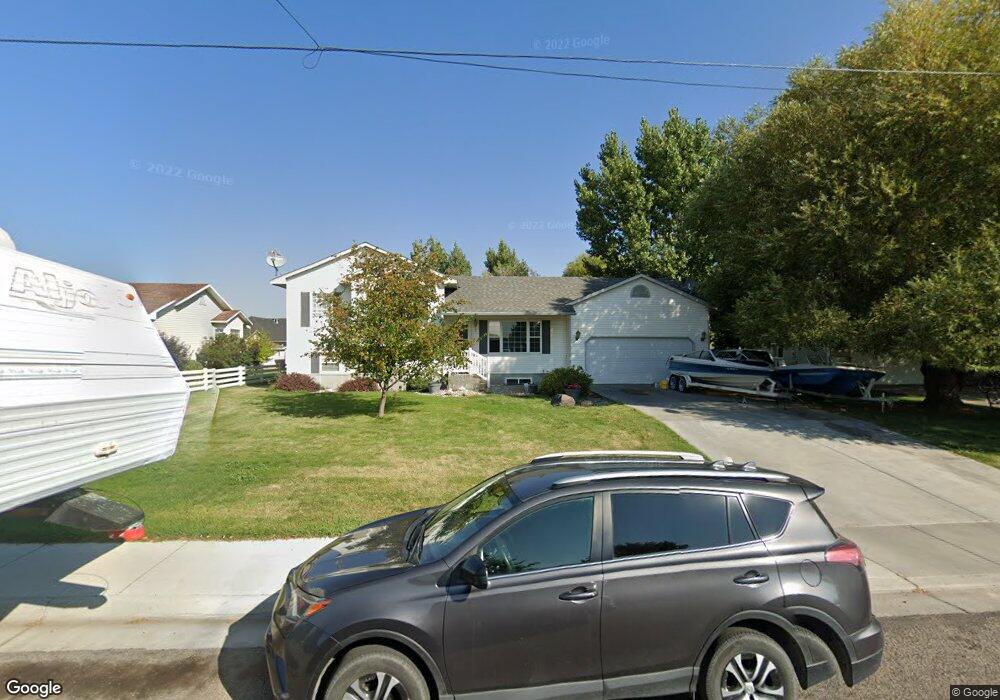
This home is located at 550 W 1st N, Rigby, ID 83442 and is currently estimated at $420,536, approximately $175 per square foot. 550 W 1st N is a home located in Jefferson County with nearby schools including Jefferson Elementary School, Rigby Middle School, and Rigby High School.
Ownership History
Date
Name
Owned For
Owner Type
Purchase Details
Closed on
Jun 27, 2019
Sold by
Brown Michelle and Brown Raymond Chandler
Bought by
Brown Raymond Chandler
Current Estimated Value
Home Financials for this Owner
Home Financials are based on the most recent Mortgage that was taken out on this home.
Original Mortgage
$211,131
Outstanding Balance
$186,094
Interest Rate
4.12%
Mortgage Type
FHA
Estimated Equity
$234,442
Purchase Details
Closed on
Jun 26, 2019
Sold by
Lindsey Gerald Stephen
Bought by
Brown Raymond Chandler
Home Financials for this Owner
Home Financials are based on the most recent Mortgage that was taken out on this home.
Original Mortgage
$211,131
Outstanding Balance
$186,094
Interest Rate
4.12%
Mortgage Type
FHA
Estimated Equity
$234,442
Purchase Details
Closed on
Jan 14, 2015
Sold by
Lindsey Louise
Bought by
Living Trust Of Louise Leola Lindsey
Create a Home Valuation Report for This Property
The Home Valuation Report is an in-depth analysis detailing your home's value as well as a comparison with similar homes in the area
Home Values in the Area
Average Home Value in this Area
Purchase History
| Date | Buyer | Sale Price | Title Company |
|---|---|---|---|
| Brown Raymond Chandler | -- | Alliance Ttl Rexburg Office | |
| Brown Raymond Chandler | -- | Alliance Ttl Rexburg Office | |
| Living Trust Of Louise Leola Lindsey | -- | None Available |
Source: Public Records
Mortgage History
| Date | Status | Borrower | Loan Amount |
|---|---|---|---|
| Open | Brown Raymond Chandler | $211,131 |
Source: Public Records
Tax History Compared to Growth
Tax History
| Year | Tax Paid | Tax Assessment Tax Assessment Total Assessment is a certain percentage of the fair market value that is determined by local assessors to be the total taxable value of land and additions on the property. | Land | Improvement |
|---|---|---|---|---|
| 2024 | $2,273 | $387,078 | $0 | $0 |
| 2023 | $2,273 | $398,502 | $0 | $0 |
| 2022 | $2,931 | $354,743 | $0 | $0 |
| 2021 | $2,574 | $278,094 | $0 | $0 |
| 2020 | $2,318 | $258,041 | $0 | $0 |
| 2019 | $4,330 | $236,376 | $0 | $0 |
| 2018 | $3,994 | $201,302 | $0 | $0 |
| 2017 | $3,701 | $178,150 | $0 | $0 |
| 2016 | $1,873 | $87,020 | $0 | $0 |
| 2015 | $1,854 | $82,246 | $0 | $0 |
| 2014 | $1,830 | $81,291 | $0 | $0 |
| 2013 | -- | $73,654 | $0 | $0 |
Source: Public Records
Map
Nearby Homes