5500 James Ave N Minneapolis, MN 55430
Lions NeighborhoodEstimated Value: $255,000 - $277,000
3
Beds
1
Bath
1,036
Sq Ft
$260/Sq Ft
Est. Value
About This Home
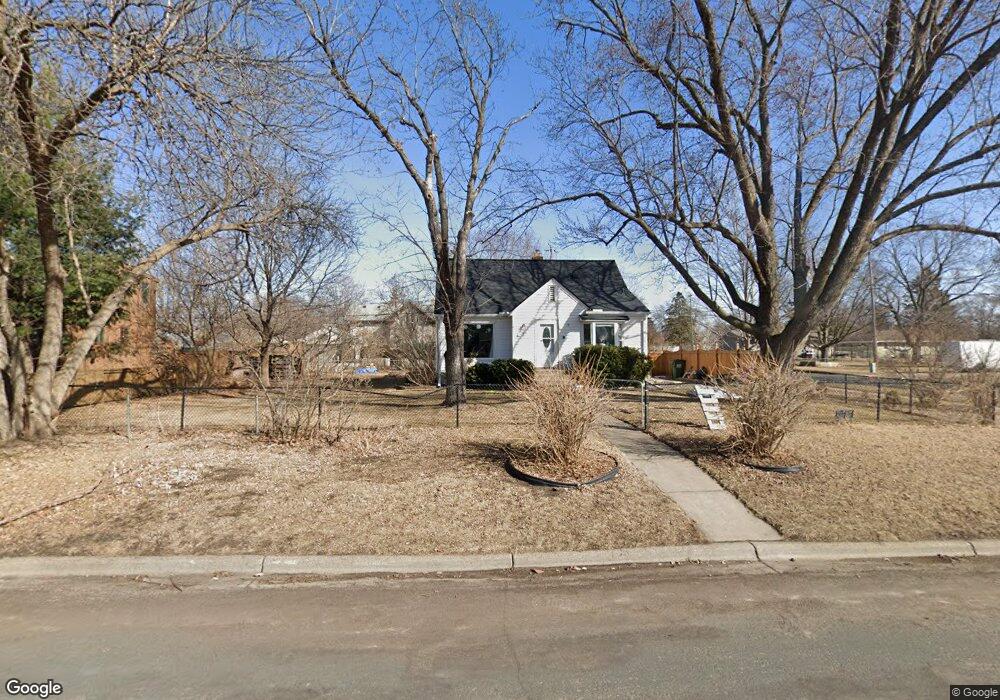
This home is located at 5500 James Ave N, Minneapolis, MN 55430 and is currently estimated at $268,897, approximately $259 per square foot. 5500 James Ave N is a home located in Hennepin County with nearby schools including Brooklyn Center Elementary STEAM, Progeny Academy, and Bright Water MontessoriSchool.
Ownership History
Date
Name
Owned For
Owner Type
Purchase Details
Closed on
May 27, 2016
Sold by
Delanghe Estates Llc
Bought by
Lininger Natalie
Current Estimated Value
Home Financials for this Owner
Home Financials are based on the most recent Mortgage that was taken out on this home.
Original Mortgage
$153,174
Interest Rate
4.37%
Mortgage Type
FHA
Purchase Details
Closed on
Jul 19, 2014
Sold by
Scott Leah R and Scott William E
Bought by
Delanghe Estates Llc
Purchase Details
Closed on
Jul 29, 2013
Sold by
Federal National Mortgage Association
Bought by
Dunn Leah R A and Scott Leah
Purchase Details
Closed on
Mar 7, 2013
Sold by
Jpmorgan Chase Bank National Association
Bought by
Federal National Mortgage Associatiion
Purchase Details
Closed on
Feb 26, 2013
Sold by
Dunn Leah R A
Bought by
Jpmorgan Chase Bank Na
Purchase Details
Closed on
Mar 28, 2003
Sold by
Lenz Dellis R and Lenz Marianne
Bought by
Dunn Leah R A
Create a Home Valuation Report for This Property
The Home Valuation Report is an in-depth analysis detailing your home's value as well as a comparison with similar homes in the area
Home Values in the Area
Average Home Value in this Area
Purchase History
| Date | Buyer | Sale Price | Title Company |
|---|---|---|---|
| Lininger Natalie | $156,000 | Titlesmart Inc | |
| Delanghe Estates Llc | $65,300 | Title & Closing Inc | |
| Dunn Leah R A | -- | None Available | |
| -- | $65,300 | -- | |
| Federal National Mortgage Associatiion | -- | None Available | |
| Jpmorgan Chase Bank Na | $179,980 | None Available | |
| Dunn Leah R A | $168,900 | -- |
Source: Public Records
Mortgage History
| Date | Status | Borrower | Loan Amount |
|---|---|---|---|
| Previous Owner | Lininger Natalie | $153,174 |
Source: Public Records
Tax History Compared to Growth
Tax History
| Year | Tax Paid | Tax Assessment Tax Assessment Total Assessment is a certain percentage of the fair market value that is determined by local assessors to be the total taxable value of land and additions on the property. | Land | Improvement |
|---|---|---|---|---|
| 2024 | $4,561 | $235,100 | $66,000 | $169,100 |
| 2023 | $4,953 | $223,100 | $54,000 | $169,100 |
| 2022 | $4,691 | $240,000 | $76,000 | $164,000 |
| 2021 | $3,819 | $207,000 | $63,000 | $144,000 |
| 2020 | $3,845 | $191,000 | $56,000 | $135,000 |
| 2019 | $2,656 | $173,000 | $50,000 | $123,000 |
| 2018 | $2,063 | $151,000 | $49,000 | $102,000 |
| 2017 | $1,660 | $118,000 | $35,000 | $83,000 |
| 2016 | $2,372 | $120,100 | $40,000 | $80,100 |
| 2015 | $1,988 | $103,600 | $35,900 | $67,700 |
| 2014 | -- | $98,900 | $34,400 | $64,500 |
Source: Public Records
Map
Nearby Homes
- 5524 Humboldt Ave N
- 5557 Logan Ave N
- 5527 Fremont Ave N
- 5344 Girard Ave N
- 5706 Girard Ave N
- 5239 Humboldt Ave N
- 5715 Emerson Ave N
- 5307 Newton Ave N
- 5842 James Ave N
- 5135 Irving Ave N
- 5637 Bryant Ave N
- 5118 James Ave N
- 5500 Bryant Ave N
- 5146 Newton Ave N
- 5252 Queen Ave N
- 5253 Queen Ave N
- 5101 Fremont Ave N
- 5136 Queen Ave N
- 6000 Girard Ave N
- 5225 N 6th St
- 5510 James Ave N
- 5501 Irving Ave N
- 5442 James Ave N
- 5501 James Ave N
- 5507 Irving Ave N
- 5520 James Ave N
- 5443 Irving Ave N
- 5517 James Ave N
- 5449 James Ave N
- 5513 Irving Ave N
- 5436 James Ave N
- 5525 James Ave N
- 5437 Irving Ave N
- 5530 James Ave N
- 5437 James Ave N
- 5500 Knox Ave N
- 5508 Knox Ave N
- 5519 Irving Ave N
- 5430 James Ave N
- 1508 55th Ave N