
Seller's Agent in 2025
Don Moats
BDR Real Estate Services, LLC
(717) 504-5671
29 Total Sales
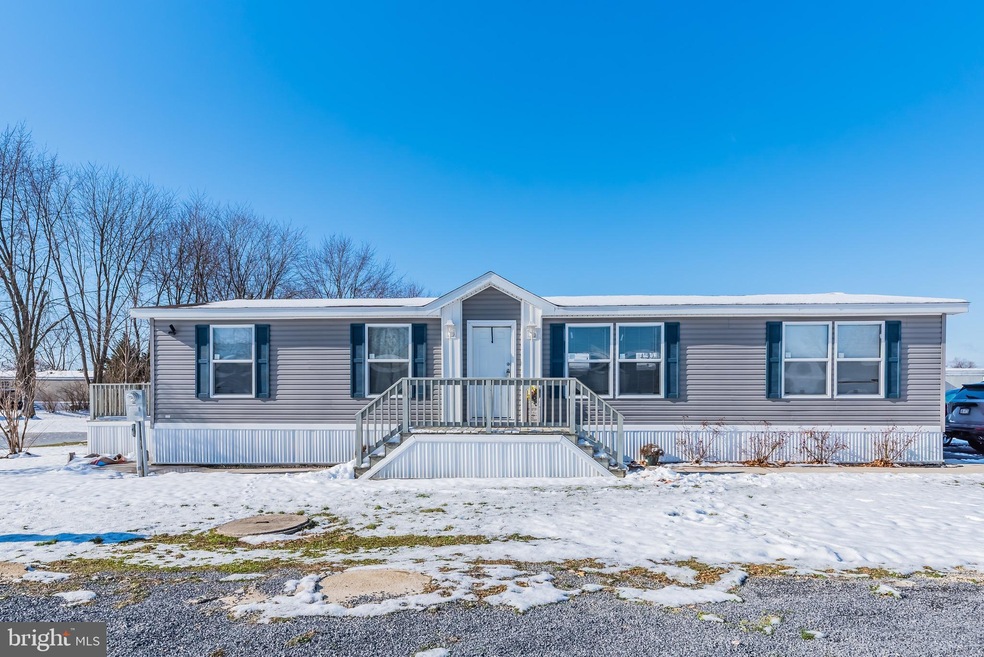
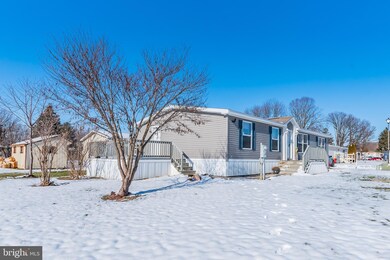
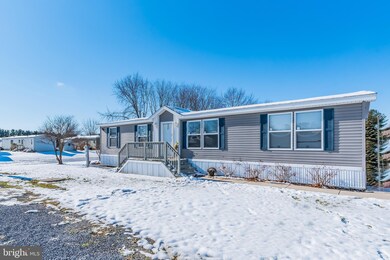
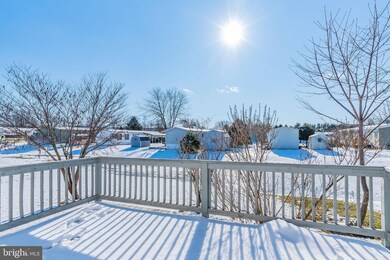
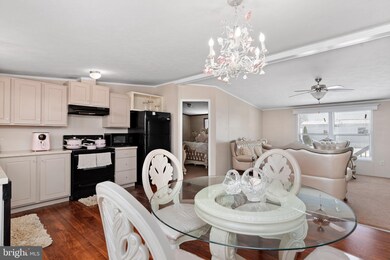
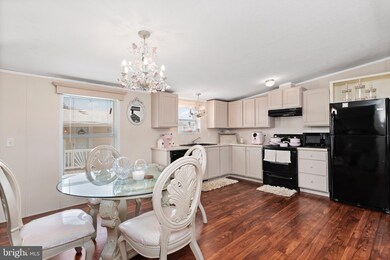
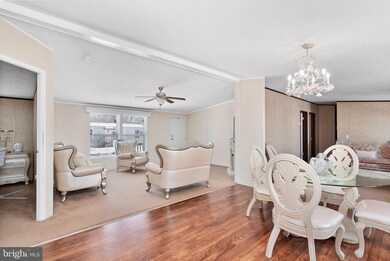
Back on the market - nothing is wrong with this home buyer had a change of heart. Well-maintained manufactured home located in Colonial Estates. This spacious 1500 square foot 3 BD, 2 BA rancher-style home boasts an open floor plan with an updated eat-in kitchen, owner suite, optional two living rooms, and a rear deck. Comfortable and affordable living close to town! Community approval is required. Saturday/Sunday showings only.
Last Agent to Sell the Property
Iron Valley Real Estate of Chambersburg Listed on: 01/12/2022
Home Type
Est. Annual Taxes
Year Built
Lot Details
Home Design
Interior Spaces
Kitchen
Bedrooms and Bathrooms
Parking
Utilities
Community Details
Listing and Financial Details
| Date | Event | Price | Change | Sq Ft Price |
|---|---|---|---|---|
| 05/30/2025 05/30/25 | Sold | $135,400 | +63.1% | $104 / Sq Ft |
| 02/22/2025 02/22/25 | Pending | -- | -- | -- |
| 10/18/2024 10/18/24 | Sold | $83,000 | -7.8% | $62 / Sq Ft |
| 09/16/2024 09/16/24 | Pending | -- | -- | -- |
| 08/28/2024 08/28/24 | For Sale | $90,000 | -35.7% | $67 / Sq Ft |
| 07/16/2024 07/16/24 | Price Changed | $139,900 | -6.7% | $108 / Sq Ft |
| 01/02/2024 01/02/24 | Price Changed | $149,900 | -5.7% | $116 / Sq Ft |
| 04/12/2023 04/12/23 | For Sale | $159,000 | +208.7% | $123 / Sq Ft |
| 03/03/2023 03/03/23 | Sold | $51,500 | -8.0% | $45 / Sq Ft |
| 02/13/2023 02/13/23 | Pending | -- | -- | -- |
| 01/27/2023 01/27/23 | Price Changed | $56,000 | -3.4% | $49 / Sq Ft |
| 01/09/2023 01/09/23 | Price Changed | $58,000 | -6.5% | $50 / Sq Ft |
| 12/29/2022 12/29/22 | For Sale | $62,000 | +20.4% | $54 / Sq Ft |
| 12/28/2022 12/28/22 | Off Market | $51,500 | -- | -- |
| 12/27/2022 12/27/22 | Price Changed | $62,000 | +313.3% | $54 / Sq Ft |
| 12/09/2022 12/09/22 | Sold | $15,000 | -77.9% | -- |
| 11/22/2022 11/22/22 | For Sale | $68,000 | +353.3% | $59 / Sq Ft |
| 11/18/2022 11/18/22 | Pending | -- | -- | -- |
| 11/14/2022 11/14/22 | Price Changed | $15,000 | -24.6% | -- |
| 11/08/2022 11/08/22 | Price Changed | $19,900 | -20.4% | -- |
| 10/05/2022 10/05/22 | For Sale | $25,000 | -68.1% | -- |
| 05/19/2022 05/19/22 | Sold | $78,300 | +11.9% | $52 / Sq Ft |
| 04/18/2022 04/18/22 | Pending | -- | -- | -- |
| 04/13/2022 04/13/22 | Sold | $70,000 | -17.6% | $38 / Sq Ft |
| 03/21/2022 03/21/22 | For Sale | $85,000 | +6.3% | $57 / Sq Ft |
| 03/21/2022 03/21/22 | Pending | -- | -- | -- |
| 02/21/2022 02/21/22 | For Sale | $80,000 | -5.9% | $43 / Sq Ft |
| 02/09/2022 02/09/22 | Pending | -- | -- | -- |
| 01/12/2022 01/12/22 | For Sale | $85,000 | +226.9% | $57 / Sq Ft |
| 11/19/2020 11/19/20 | Sold | $26,000 | -7.1% | $26 / Sq Ft |
| 10/24/2020 10/24/20 | Pending | -- | -- | -- |
| 10/21/2020 10/21/20 | For Sale | $28,000 | +21.7% | $28 / Sq Ft |
| 09/25/2016 09/25/16 | Sold | $23,000 | -11.2% | $20 / Sq Ft |
| 09/12/2016 09/12/16 | Pending | -- | -- | -- |
| 08/18/2016 08/18/16 | For Sale | $25,900 | -13.4% | $22 / Sq Ft |
| 05/16/2016 05/16/16 | Sold | $29,900 | -32.0% | $24 / Sq Ft |
| 04/04/2016 04/04/16 | Pending | -- | -- | -- |
| 04/01/2016 04/01/16 | Sold | $44,000 | +47.2% | $26 / Sq Ft |
| 03/24/2016 03/24/16 | Pending | -- | -- | -- |
| 03/11/2016 03/11/16 | For Sale | $29,900 | -33.6% | $24 / Sq Ft |
| 10/07/2015 10/07/15 | Price Changed | $45,000 | -10.0% | $26 / Sq Ft |
| 08/20/2015 08/20/15 | Price Changed | $50,000 | -7.4% | $29 / Sq Ft |
| 07/01/2015 07/01/15 | Price Changed | $54,000 | -34.9% | $32 / Sq Ft |
| 05/05/2015 05/05/15 | Sold | $83,000 | +45.6% | $59 / Sq Ft |
| 04/18/2015 04/18/15 | For Sale | $57,000 | -48.2% | $34 / Sq Ft |
| 02/16/2015 02/16/15 | Pending | -- | -- | -- |
| 12/17/2014 12/17/14 | For Sale | $110,000 | -- | $79 / Sq Ft |
| Year | Tax Paid | Tax Assessment Tax Assessment Total Assessment is a certain percentage of the fair market value that is determined by local assessors to be the total taxable value of land and additions on the property. | Land | Improvement |
|---|---|---|---|---|
| 2025 | $6,494 | $39,870 | $22,570 | $17,300 |
| 2024 | $7,027 | $44,530 | $26,580 | $17,950 |
| 2023 | $6,809 | $44,530 | $26,580 | $17,950 |
| 2022 | $3,969 | $26,580 | $26,580 | $0 |
| 2021 | $3,969 | $26,580 | $26,580 | $0 |
| 2020 | $3,865 | $26,580 | $26,580 | $0 |
| 2019 | $3,716 | $26,580 | $26,580 | $0 |
| 2018 | $3,577 | $26,580 | $26,580 | $0 |
| 2017 | $3,456 | $26,580 | $26,580 | $0 |
| 2016 | $762 | $26,580 | $26,580 | $0 |
| 2015 | $710 | $26,580 | $26,580 | $0 |
| 2014 | $710 | $26,580 | $26,580 | $0 |
Seller's Agent in 2025
Don Moats
BDR Real Estate Services, LLC
(717) 504-5671
29 Total Sales
G
Seller's Agent in 2024
Garth Bellows
Flat Fee Realty
(717) 360-4371
83 Total Sales
Buyer's Agent in 2023
Jon Kalbaugh
Coldwell Banker Realty
(304) 268-8110
30 Total Sales
Seller's Agent in 2022
Matthew Litzinger
Coldwell Banker Realty
(717) 977-7394
71 Total Sales
Seller's Agent in 2022
Mellisa Wagaman
Iron Valley Real Estate of Chambersburg
(717) 816-3895
59 Total Sales
Seller's Agent in 2022
Paul Agosto
Berkshire Hathaway HomeServices Homesale Realty
(717) 372-8684
117 Total Sales
Source: Bright MLS
MLS Number: PAFL2004406
APN: 09-0C26-025A-000000
Disclaimer: Certain information contained herein is derived from information provided by parties other than Homes.com. All information provided is deemed reliable, but is not guaranteed to be accurate and should be independently verified.
![]() The data relating to real estate for sale on this website appears in part through the BRIGHT Internet Data Exchange program, a voluntary cooperative exchange of property listing data between licensed real estate brokerage firms, and is provided by BRIGHT through a licensing agreement.
The data relating to real estate for sale on this website appears in part through the BRIGHT Internet Data Exchange program, a voluntary cooperative exchange of property listing data between licensed real estate brokerage firms, and is provided by BRIGHT through a licensing agreement.
Listing information is from various brokers who participate in the Bright MLS IDX program and not all listings may be visible on the site.
The property information being provided on or through the website is for the personal, non-commercial use of consumers and such information may not be used for any purpose other than to identify prospective properties consumers may be interested in purchasing.
Some properties which appear for sale on the website may no longer be available because they are for instance, under contract, sold or are no longer being offered for sale.
Property information displayed is deemed reliable but is not guaranteed.
Copyright 2025 Bright MLS, Inc.