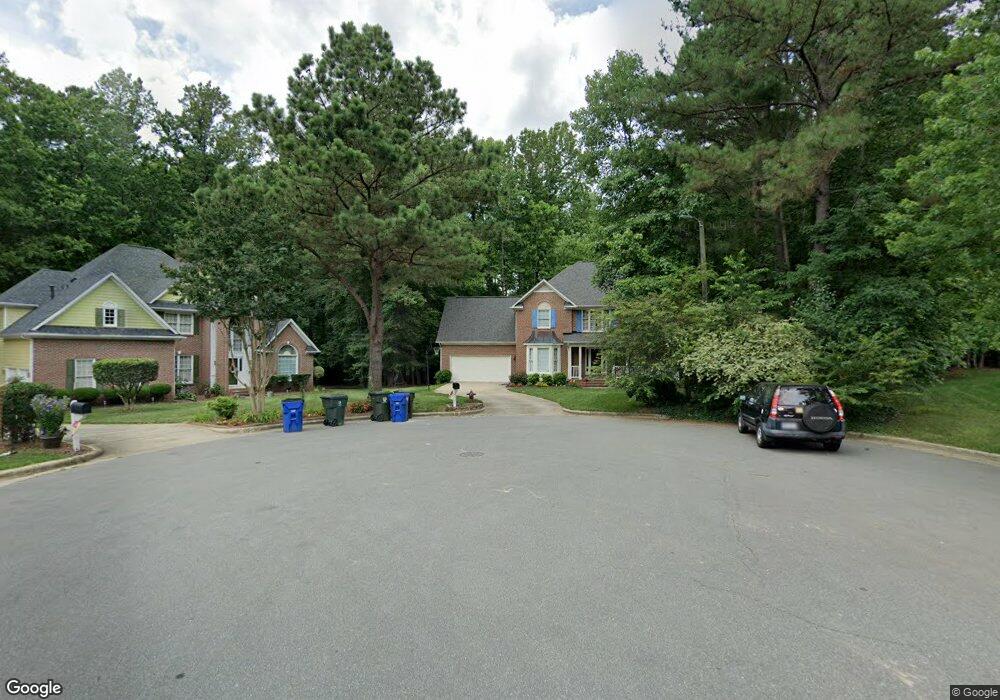
5501 Crossfield Dr Raleigh, NC 27613
Umstead NeighborhoodEstimated Value: $699,000 - $793,000
--
Bed
--
Bath
3,042
Sq Ft
$242/Sq Ft
Est. Value
About This Home
This home is located at 5501 Crossfield Dr, Raleigh, NC 27613 and is currently estimated at $736,693, approximately $242 per square foot. 5501 Crossfield Dr is a home located in Wake County with nearby schools including Sycamore Creek Elementary School, Pine Hollow Middle School, and Leesville Road High School.
Ownership History
Date
Name
Owned For
Owner Type
Purchase Details
Closed on
May 7, 2004
Sold by
Beebe Robert and Beebe Kimberly
Bought by
Agnelli Robert P and Agnelli Allison P
Current Estimated Value
Home Financials for this Owner
Home Financials are based on the most recent Mortgage that was taken out on this home.
Original Mortgage
$217,600
Outstanding Balance
$100,226
Interest Rate
5.25%
Mortgage Type
Adjustable Rate Mortgage/ARM
Estimated Equity
$636,467
Purchase Details
Closed on
Apr 30, 1999
Sold by
Rizzo Raymond P
Bought by
Beebe Robert and Beebe Kimberly
Home Financials for this Owner
Home Financials are based on the most recent Mortgage that was taken out on this home.
Original Mortgage
$198,000
Interest Rate
6.12%
Create a Home Valuation Report for This Property
The Home Valuation Report is an in-depth analysis detailing your home's value as well as a comparison with similar homes in the area
Home Values in the Area
Average Home Value in this Area
Purchase History
| Date | Buyer | Sale Price | Title Company |
|---|---|---|---|
| Agnelli Robert P | $272,000 | None Available | |
| Beebe Robert | $233,000 | -- |
Source: Public Records
Mortgage History
| Date | Status | Borrower | Loan Amount |
|---|---|---|---|
| Open | Agnelli Robert P | $217,600 | |
| Previous Owner | Beebe Robert | $198,000 |
Source: Public Records
Tax History Compared to Growth
Tax History
| Year | Tax Paid | Tax Assessment Tax Assessment Total Assessment is a certain percentage of the fair market value that is determined by local assessors to be the total taxable value of land and additions on the property. | Land | Improvement |
|---|---|---|---|---|
| 2025 | $5,908 | $675,157 | $190,000 | $485,157 |
| 2024 | $5,884 | $675,157 | $190,000 | $485,157 |
| 2023 | $4,485 | $409,602 | $85,000 | $324,602 |
| 2022 | $4,167 | $409,602 | $85,000 | $324,602 |
| 2021 | $4,005 | $409,602 | $85,000 | $324,602 |
| 2020 | $3,933 | $409,602 | $85,000 | $324,602 |
| 2019 | $3,945 | $338,669 | $85,000 | $253,669 |
| 2018 | $3,720 | $338,669 | $85,000 | $253,669 |
| 2017 | $3,543 | $338,669 | $85,000 | $253,669 |
| 2016 | $3,470 | $338,669 | $85,000 | $253,669 |
| 2015 | $3,477 | $333,880 | $80,000 | $253,880 |
| 2014 | -- | $333,880 | $80,000 | $253,880 |
Source: Public Records
Map
Nearby Homes
- Southampton Plan at Running Brook Townes
- Ashland Plan at Running Brook Townes
- Bristol Plan at Running Brook Townes
- 12317 Aberdeen Chase Way
- 5519 Spindlewood Ct
- 5608 Barham Ct
- 12116 Queensbridge Ct
- 12133 Mabledon Ct
- 11829 N Exeter Way
- 5404 Staysail Ct
- 12012 Shavenrock Place
- 6004 Eaglesfield Dr
- 5501 Stewartby Dr
- 11113 N Radner Way
- 10119 2nd Star Ct
- 5273 Fairmead Cir
- 12436 Harcourt Dr
- 10132 Marleybone Dr
- 1204 Meadow Moss Ct
- 12018 Mcbride Dr
- 5509 Crossfield Dr
- 5500 Crossfield Dr
- 12305 Timbercroft Ct
- 5504 Crossfield Dr
- 5508 Crossfield Dr
- 12301 Timbercroft Ct
- 12301 Kendall Ridge Ct
- 12313 Timbercroft Ct
- 5512 Crossfield Dr
- 12300 Kendall Ridge Ct
- 12305 Kendall Ridge Ct
- 12112 N Exeter Way
- 12116 N Exeter Way
- 5516 Crossfield Dr
- 12108 N Exeter Way
- 12304 Kendall Ridge Ct
- 12308 Timbercroft Ct
- 5601 Crossfield Dr
- 12309 Kendall Ridge Ct
- 5464 Ingate Way