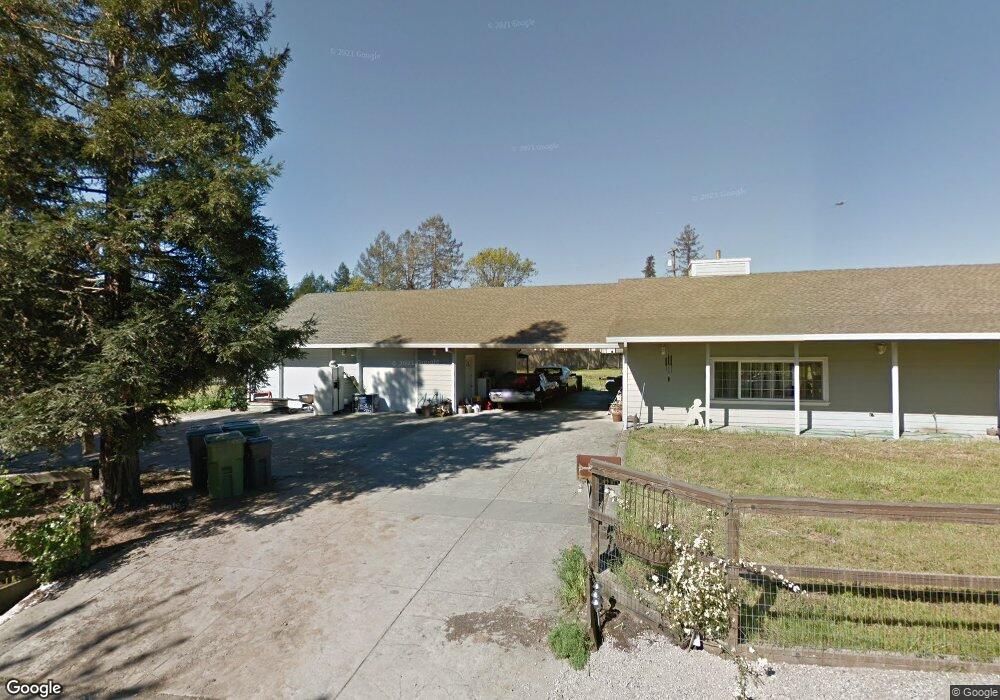
5501 Sebastopol Ave Sebastopol, CA 95472
Estimated Value: $959,000 - $1,218,558
3
Beds
2
Baths
1,974
Sq Ft
$557/Sq Ft
Est. Value
About This Home
This home is located at 5501 Sebastopol Ave, Sebastopol, CA 95472 and is currently estimated at $1,098,640, approximately $556 per square foot. 5501 Sebastopol Ave is a home located in Sonoma County with nearby schools including Park Side Elementary School, Brook Haven Elementary School, and Analy High School.
Ownership History
Date
Name
Owned For
Owner Type
Purchase Details
Closed on
Apr 21, 2021
Sold by
Hanson Randall and Hanson Judith
Bought by
Hanson Randall W and Hanson Judith L
Current Estimated Value
Home Financials for this Owner
Home Financials are based on the most recent Mortgage that was taken out on this home.
Original Mortgage
$542,500
Outstanding Balance
$407,618
Interest Rate
3.05%
Mortgage Type
New Conventional
Estimated Equity
$691,022
Purchase Details
Closed on
Jan 13, 2017
Sold by
Hanson Randall W and Hanson Judith L
Bought by
Hanson Randall W and Hanson Judith L
Purchase Details
Closed on
Aug 24, 1996
Sold by
Price Sherry I and Shapro Lillie M
Bought by
Hanson Randall W and Hanson Judith L
Home Financials for this Owner
Home Financials are based on the most recent Mortgage that was taken out on this home.
Original Mortgage
$123,200
Interest Rate
8.23%
Create a Home Valuation Report for This Property
The Home Valuation Report is an in-depth analysis detailing your home's value as well as a comparison with similar homes in the area
Home Values in the Area
Average Home Value in this Area
Purchase History
| Date | Buyer | Sale Price | Title Company |
|---|---|---|---|
| Hanson Randall W | -- | First American Title Company | |
| Hanson Randall | -- | First American Title Company | |
| Hanson Randall W | -- | Fidelity National Title Co | |
| Hanson Randall W | $154,000 | North Bay Title Co |
Source: Public Records
Mortgage History
| Date | Status | Borrower | Loan Amount |
|---|---|---|---|
| Open | Hanson Randall | $542,500 | |
| Closed | Hanson Randall W | $123,200 | |
| Closed | Hanson Randall W | $15,400 |
Source: Public Records
Tax History Compared to Growth
Tax History
| Year | Tax Paid | Tax Assessment Tax Assessment Total Assessment is a certain percentage of the fair market value that is determined by local assessors to be the total taxable value of land and additions on the property. | Land | Improvement |
|---|---|---|---|---|
| 2025 | $4,833 | $389,214 | $163,098 | $226,116 |
| 2024 | $4,833 | $381,583 | $159,900 | $221,683 |
| 2023 | $4,833 | $374,102 | $156,765 | $217,337 |
| 2022 | $4,668 | $366,768 | $153,692 | $213,076 |
| 2021 | $4,631 | $359,578 | $150,679 | $208,899 |
| 2020 | $4,560 | $349,391 | $149,134 | $200,257 |
| 2019 | $3,710 | $285,188 | $146,210 | $138,978 |
| 2018 | $3,508 | $279,597 | $143,344 | $136,253 |
| 2017 | $3,365 | $274,116 | $140,534 | $133,582 |
| 2016 | $3,296 | $268,742 | $137,779 | $130,963 |
| 2015 | -- | $264,706 | $135,710 | $128,996 |
| 2014 | -- | $259,522 | $133,052 | $126,470 |
Source: Public Records
Map
Nearby Homes
- 4600 Occidental Rd
- 644 Piezzi Rd
- 1920 Ludwig Ave
- 560 Irwin Ln
- 4401 Price Ave
- 5695 Bravo Toro Ln
- 5505 Bravo Toro Ln
- 1681 S Wright Rd
- 5200 California 116
- 6781 Evergreen Ave
- 5301 Gravenstein Hwy S
- 451 S High St
- 1645 S Wright Rd
- 1466 Cooper Rd
- 6917 Redwood Ave
- 830 Litchfield Ave
- 1171 Gravenstein Hwy S
- 4020 Madera Ave
- 1853 Cooper Rd
- 7251 Fircrest Ave
- 1192 Ozone Dr
- 5513 Sebastopol Ave
- 1181 Ozone Dr
- 5521 Sebastopol Ave
- 5367 Sebastopol Rd
- 5368 Sebastopol Rd
- 5368 Highway 12 Rd
- 1135 Ozone Dr
- 1136 Duer Rd
- 5533 Sebastopol Ave
- 1129 Ozone Dr
- 5533 Duer Rd
- 1186 Ozone Dr
- 1170 Ozone Dr
- 1142 Duer Rd
- 1121 Ozone Dr
- 5380 Sebastopol Rd
- 1144 Ozone Dr
- 1130 Duer Rd
- 1113 Ozone Dr