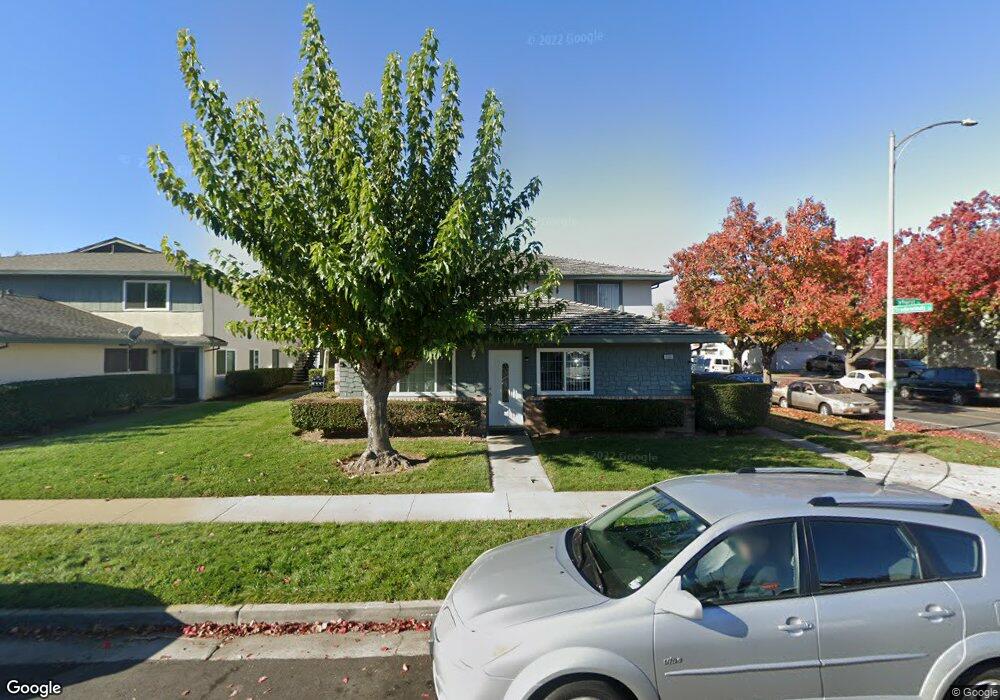
5501 Tyhurst Ct Unit 1 San Jose, CA 95123
Oak Grove NeighborhoodEstimated Value: $472,000 - $501,000
2
Beds
1
Bath
810
Sq Ft
$607/Sq Ft
Est. Value
About This Home
This home is located at 5501 Tyhurst Ct Unit 1, San Jose, CA 95123 and is currently estimated at $491,301, approximately $606 per square foot. 5501 Tyhurst Ct Unit 1 is a home located in Santa Clara County with nearby schools including Hayes Elementary School, Davis (Caroline) Intermediate School, and Oak Grove High School.
Ownership History
Date
Name
Owned For
Owner Type
Purchase Details
Closed on
Sep 27, 2005
Sold by
Serrano Veronica A
Bought by
Serrano Norman S
Current Estimated Value
Home Financials for this Owner
Home Financials are based on the most recent Mortgage that was taken out on this home.
Original Mortgage
$284,000
Outstanding Balance
$149,125
Interest Rate
5.46%
Mortgage Type
Negative Amortization
Estimated Equity
$342,176
Purchase Details
Closed on
Jun 14, 2004
Sold by
Pando Ezequiel
Bought by
Serrano Norman S
Home Financials for this Owner
Home Financials are based on the most recent Mortgage that was taken out on this home.
Original Mortgage
$216,000
Interest Rate
6.04%
Mortgage Type
Purchase Money Mortgage
Purchase Details
Closed on
Mar 18, 2004
Sold by
Contartese Kristie and Mccormick Brenda
Bought by
Pando Ezequiel
Purchase Details
Closed on
Apr 25, 2001
Sold by
Mccormick Herbert B
Bought by
Mccormick Herbert B
Create a Home Valuation Report for This Property
The Home Valuation Report is an in-depth analysis detailing your home's value as well as a comparison with similar homes in the area
Home Values in the Area
Average Home Value in this Area
Purchase History
| Date | Buyer | Sale Price | Title Company |
|---|---|---|---|
| Serrano Norman S | -- | Alliance Title Company | |
| Serrano Norman S | $270,000 | Fidelity National Title Ins | |
| Pando Ezequiel | $235,000 | Alliance Title Company | |
| Mccormick Herbert B | -- | -- |
Source: Public Records
Mortgage History
| Date | Status | Borrower | Loan Amount |
|---|---|---|---|
| Open | Serrano Norman S | $284,000 | |
| Closed | Serrano Norman S | $216,000 | |
| Closed | Serrano Norman S | $54,000 |
Source: Public Records
Tax History Compared to Growth
Tax History
| Year | Tax Paid | Tax Assessment Tax Assessment Total Assessment is a certain percentage of the fair market value that is determined by local assessors to be the total taxable value of land and additions on the property. | Land | Improvement |
|---|---|---|---|---|
| 2025 | $5,231 | $383,866 | $191,933 | $191,933 |
| 2024 | $5,231 | $376,340 | $188,170 | $188,170 |
| 2023 | $5,231 | $368,962 | $184,481 | $184,481 |
| 2022 | $5,134 | $361,728 | $180,864 | $180,864 |
| 2021 | $5,067 | $354,636 | $177,318 | $177,318 |
| 2020 | $4,991 | $351,000 | $175,500 | $175,500 |
| 2019 | $4,889 | $344,118 | $172,059 | $172,059 |
| 2018 | $4,860 | $337,372 | $168,686 | $168,686 |
| 2017 | $4,797 | $330,758 | $165,379 | $165,379 |
| 2016 | $4,558 | $324,274 | $162,137 | $162,137 |
| 2015 | $3,877 | $274,000 | $137,000 | $137,000 |
| 2014 | $3,537 | $258,000 | $129,000 | $129,000 |
Source: Public Records
Map
Nearby Homes
- 5503 Eagles Ln Unit 2
- 262 Tradewinds Ct Unit 4
- 5532 Spinnaker Dr Unit 2
- 5550 Spinnaker Dr Unit 1
- 5558 Judith St Unit 1
- 341 Blossom Hill Rd Unit 3
- 329 Blossom Hill Rd Unit 4
- 224 Coy Dr Unit 1
- 196 Coy Dr Unit 1
- 323 Blossom Hill Rd Unit 2
- 201 Pecan Grove Ct
- 275 Tradewinds Dr Unit 11
- 285 Tradewinds Dr Unit 6
- 5629 Judith St
- 5631 Herma St
- 310 Tradewinds Dr Unit 8
- 309 Tradewinds Dr Unit 3
- 291 Tradewinds Dr Unit 7
- 303 Tradewinds Dr Unit 10
- 5506 Sean Cir Unit 112
- 5501 Tyhurst Ct Unit 4
- 5501 Tyhurst Ct Unit 3
- 5501 Tyhurst Ct Unit 2
- 5461 Tyhurst Ct Unit 4
- 5461 Tyhurst Ct Unit WW
- 5461 Tyhurst Ct Unit 3
- 5509 Tyhurst Ct Unit 4
- 5509 Tyhurst Ct Unit 3
- 5509 Tyhurst Ct Unit 2
- 5509 Tyhurst Ct Unit 1
- 5486 Tyhurst Ct Unit 1
- 5486 Tyhurst Ct Unit WW
- 5474 Tyhurst Ct Unit WW
- 5474 Tyhurst Ct Unit 2
- 5468 Tyhurst Ct Unit 1
- 5474 Tyhurst Ct Unit 3
- 254 Tradewinds Ct Unit 2
- 254 Tradewinds Ct Unit 1
- 254 Tradewinds Ct Unit 4
- 254 Tradewinds Ct Unit 3