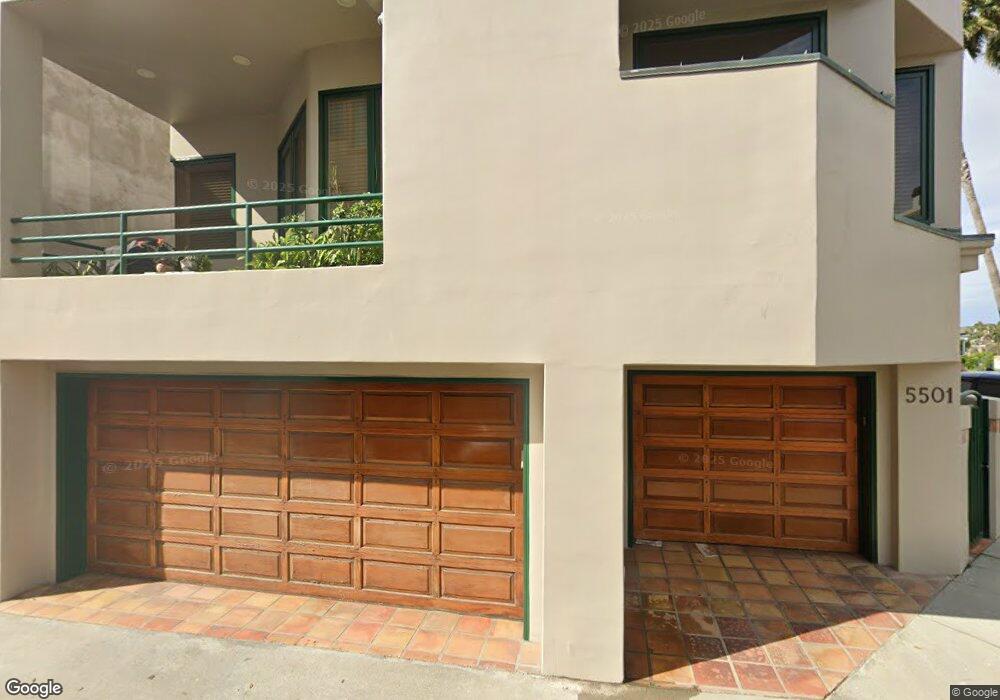
5501 Via Donte Marina Del Rey, CA 90292
Estimated Value: $4,590,449 - $6,636,000
4
Beds
6
Baths
5,965
Sq Ft
$896/Sq Ft
Est. Value
About This Home
This home is located at 5501 Via Donte, Marina Del Rey, CA 90292 and is currently estimated at $5,344,112, approximately $895 per square foot. 5501 Via Donte is a home located in Los Angeles County with nearby schools including Coeur D'Alene Avenue Elementary School, Marina Del Rey Middle School, and Venice High School.
Ownership History
Date
Name
Owned For
Owner Type
Purchase Details
Closed on
Aug 14, 2013
Sold by
Kessler Morris
Bought by
Kessler Morris and Kessler Debra J
Current Estimated Value
Home Financials for this Owner
Home Financials are based on the most recent Mortgage that was taken out on this home.
Original Mortgage
$1,355,000
Outstanding Balance
$927,065
Interest Rate
2.5%
Mortgage Type
New Conventional
Estimated Equity
$4,417,047
Purchase Details
Closed on
Feb 29, 2008
Sold by
Kessler Morris and Kessler Debra
Bought by
Kessler Morris
Purchase Details
Closed on
Nov 26, 1996
Sold by
Custom Lithograph
Bought by
Kessler Morris
Home Financials for this Owner
Home Financials are based on the most recent Mortgage that was taken out on this home.
Original Mortgage
$1,000,000
Interest Rate
7.86%
Create a Home Valuation Report for This Property
The Home Valuation Report is an in-depth analysis detailing your home's value as well as a comparison with similar homes in the area
Home Values in the Area
Average Home Value in this Area
Purchase History
| Date | Buyer | Sale Price | Title Company |
|---|---|---|---|
| Kessler Morris | -- | Ortc | |
| Kessler Morris | -- | None Available | |
| Kessler Morris | -- | None Available | |
| Kessler Morris | $1,421,000 | Equity Title Company |
Source: Public Records
Mortgage History
| Date | Status | Borrower | Loan Amount |
|---|---|---|---|
| Open | Kessler Morris | $1,355,000 | |
| Closed | Kessler Morris | $1,000,000 |
Source: Public Records
Tax History Compared to Growth
Tax History
| Year | Tax Paid | Tax Assessment Tax Assessment Total Assessment is a certain percentage of the fair market value that is determined by local assessors to be the total taxable value of land and additions on the property. | Land | Improvement |
|---|---|---|---|---|
| 2025 | $27,749 | $2,314,378 | $632,252 | $1,682,126 |
| 2024 | $27,749 | $2,268,999 | $619,855 | $1,649,144 |
| 2023 | $27,213 | $2,224,509 | $607,701 | $1,616,808 |
| 2022 | $25,947 | $2,180,892 | $595,786 | $1,585,106 |
| 2021 | $25,607 | $2,138,130 | $584,104 | $1,554,026 |
| 2019 | $24,836 | $2,074,714 | $566,780 | $1,507,934 |
| 2018 | $24,715 | $2,034,034 | $555,667 | $1,478,367 |
| 2016 | $23,599 | $1,955,052 | $534,091 | $1,420,961 |
| 2015 | $23,252 | $1,925,686 | $526,069 | $1,399,617 |
| 2014 | $23,317 | $1,887,966 | $515,765 | $1,372,201 |
Source: Public Records
Map
Nearby Homes
- 115 Via Marina
- 24 Westwind St Unit C
- 24 Voyage St Unit 2
- 6 Voyage St Unit 108
- 6 Voyage St Unit 101
- 18 Union Jack St Unit 302
- 5205 Ocean Front Walk Unit 201
- 5106 Pacific Ave
- 16 Spinnaker St
- 306 Bora Way Unit 206
- 306 Bora Way Unit 202
- 1 Spinnaker St Unit 2
- 14 Reef St Unit 4
- 33 Reef St Unit 5
- 15 Reef St
- 16 Quarterdeck St Unit 102
- 6202 Pacific Ave
- 6209 Pacific Ave Unit 201
- 6220 Pacific Ave Unit 303
- 311 Bora Way Unit 3207
- 5505 Via Donte
- 113 Channel Pointe Mall
- 5509 Via Donte
- 5417 Via Donte
- 114 Channel Pointe Mall
- 5515 Via Donte
- 5415 Via Donte
- 118 Channel Pointe Mall
- 115 Channel Pointe Mall
- 5519 Via Donte
- 5409 Via Donte
- 117 Channel Pointe Mall
- 122 Channel Pointe Mall
- 119 Via Marina
- 123 Channel Pointe Mall
- 126 0000 Mall
- 126 Channel Pointe Mall
- 127 Via Marina
- 123 Via Marina
- 125 Channel Pointe Mall