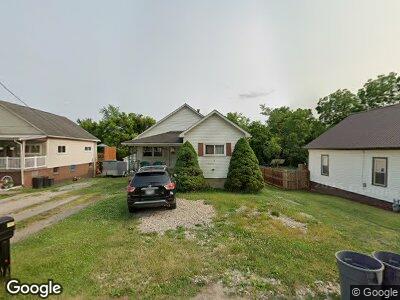
55018 Maple Ave Bridgeport, OH 43912
Lansing NeighborhoodEstimated Value: $86,000 - $119,000
3
Beds
2
Baths
1,064
Sq Ft
$97/Sq Ft
Est. Value
About This Home
This home is located at 55018 Maple Ave, Bridgeport, OH 43912 and is currently estimated at $103,458, approximately $97 per square foot. 55018 Maple Ave is a home located in Belmont County with nearby schools including Bridgeport Elementary School, Bridgeport Middle School, and Bridgeport High School.
Ownership History
Date
Name
Owned For
Owner Type
Purchase Details
Closed on
May 11, 2006
Sold by
Pomaranski Christine M
Bought by
Sells James E and Sells Mary Lee
Current Estimated Value
Home Financials for this Owner
Home Financials are based on the most recent Mortgage that was taken out on this home.
Original Mortgage
$53,200
Outstanding Balance
$39,724
Interest Rate
11.55%
Mortgage Type
Purchase Money Mortgage
Estimated Equity
$73,716
Purchase Details
Closed on
May 8, 2001
Sold by
Pomaranski Stanley G
Bought by
Pomaranski Stanley G
Purchase Details
Closed on
Dec 14, 2000
Bought by
Slenski Michael J Et 2
Purchase Details
Closed on
Jan 1, 1986
Sold by
Slenski Stella
Bought by
Slenski Stella
Create a Home Valuation Report for This Property
The Home Valuation Report is an in-depth analysis detailing your home's value as well as a comparison with similar homes in the area
Home Values in the Area
Average Home Value in this Area
Purchase History
| Date | Buyer | Sale Price | Title Company |
|---|---|---|---|
| Sells James E | $56,000 | Eagle Title Agency | |
| Pomaranski Stanley G | $50,000 | -- | |
| Slenski Michael J Et 2 | -- | -- | |
| Slenski Stella | -- | -- |
Source: Public Records
Mortgage History
| Date | Status | Borrower | Loan Amount |
|---|---|---|---|
| Open | Sells James E | $53,200 |
Source: Public Records
Tax History Compared to Growth
Tax History
| Year | Tax Paid | Tax Assessment Tax Assessment Total Assessment is a certain percentage of the fair market value that is determined by local assessors to be the total taxable value of land and additions on the property. | Land | Improvement |
|---|---|---|---|---|
| 2024 | $674 | $27,140 | $2,670 | $24,470 |
| 2023 | $414 | $20,330 | $2,650 | $17,680 |
| 2022 | $429 | $20,324 | $2,646 | $17,678 |
| 2021 | $427 | $20,324 | $2,646 | $17,678 |
| 2020 | $351 | $17,690 | $2,300 | $15,390 |
| 2019 | $353 | $17,690 | $2,300 | $15,390 |
| 2018 | $361 | $17,690 | $2,300 | $15,390 |
| 2017 | $231 | $14,010 | $2,580 | $11,430 |
| 2016 | $236 | $14,010 | $2,580 | $11,430 |
| 2015 | $235 | $14,010 | $2,580 | $11,430 |
| 2014 | $234 | $13,780 | $2,350 | $11,430 |
| 2013 | $213 | $13,780 | $2,350 | $11,430 |
Source: Public Records
Map
Nearby Homes
- 68511 Liston Ave
- 68290 Orchard Ave
- 8 Frederick St
- 67070 Willow Brook Ln
- 56559 Boyd Ave
- 54777 Gatts Rd
- 1116 Howard St
- 0 Poplar Dr Unit 4491238
- 53206 Poplar Dr
- 0 County Road 10
- 70571 Pine Hollow Rd
- 69479 Sunset Heights
- 810 Howard St
- 56745 Ferryview Rd
- 0 Maple Dr Unit T9516724
- 67578 Kirkwood Heights Rd
- 516 Bennett St
- 67551 Kirkwood Heights Rd
- 508 W Bennett
- 62 Laipple St