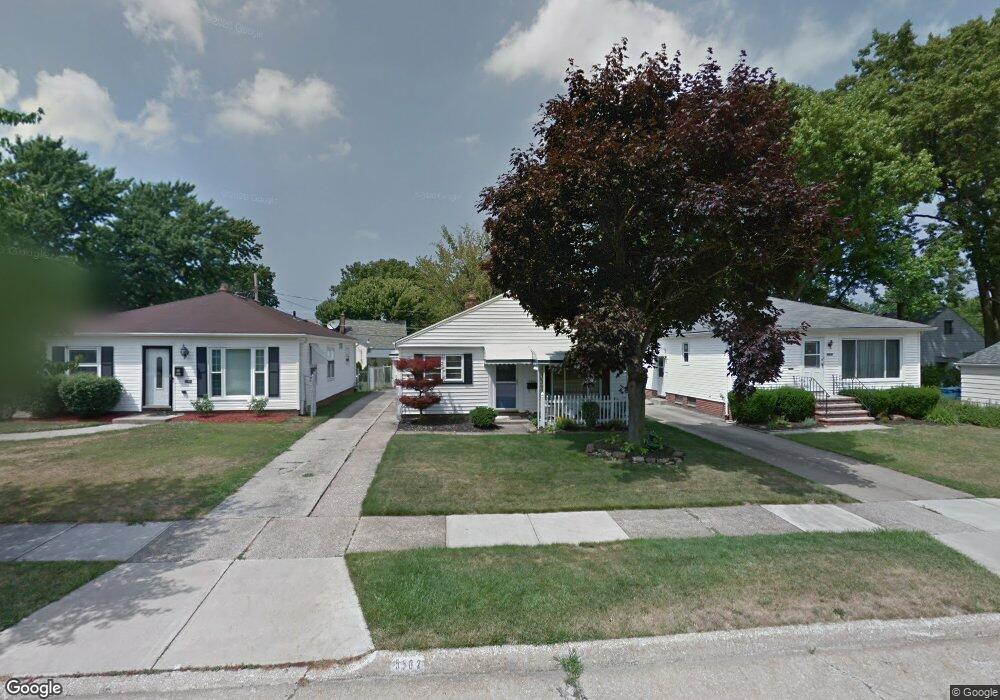
5502 Haverhill Ave Cleveland, OH 44129
Estimated Value: $182,000 - $202,000
3
Beds
1
Bath
1,064
Sq Ft
$178/Sq Ft
Est. Value
About This Home
This home is located at 5502 Haverhill Ave, Cleveland, OH 44129 and is currently estimated at $189,667, approximately $178 per square foot. 5502 Haverhill Ave is a home located in Cuyahoga County with nearby schools including Thoreau Park Elementary School, Renwood Elementary School, and Shiloh Middle School.
Ownership History
Date
Name
Owned For
Owner Type
Purchase Details
Closed on
Dec 26, 2000
Sold by
Mucci Rosemarie
Bought by
Dagy Sharon M
Current Estimated Value
Home Financials for this Owner
Home Financials are based on the most recent Mortgage that was taken out on this home.
Original Mortgage
$81,000
Outstanding Balance
$30,384
Interest Rate
7.77%
Estimated Equity
$159,283
Purchase Details
Closed on
Sep 16, 1988
Sold by
Murphy Santina S
Bought by
Mucci Rosemarie
Purchase Details
Closed on
Jan 28, 1985
Sold by
Saporito Jam A
Bought by
Murphy Santina S
Purchase Details
Closed on
Oct 12, 1984
Sold by
Saporito Joseph
Bought by
Saporito Jam A
Purchase Details
Closed on
Sep 18, 1981
Sold by
Saporito Santina T
Bought by
Saporito Joseph
Purchase Details
Closed on
Jun 3, 1978
Sold by
Boreczky Edward S
Bought by
Saporito Santina T
Purchase Details
Closed on
Jul 9, 1976
Sold by
Miller Glen E and H D
Bought by
Boreczky Edward S
Purchase Details
Closed on
Jan 1, 1975
Bought by
Miller Glen E and H D
Create a Home Valuation Report for This Property
The Home Valuation Report is an in-depth analysis detailing your home's value as well as a comparison with similar homes in the area
Home Values in the Area
Average Home Value in this Area
Purchase History
| Date | Buyer | Sale Price | Title Company |
|---|---|---|---|
| Dagy Sharon M | $90,000 | -- | |
| Mucci Rosemarie | $63,000 | -- | |
| Murphy Santina S | -- | -- | |
| Saporito Jam A | -- | -- | |
| Saporito Joseph | -- | -- | |
| Saporito Santina T | $43,900 | -- | |
| Boreczky Edward S | -- | -- | |
| Boreczky Edward S | $33,500 | -- | |
| Miller Glen E | -- | -- |
Source: Public Records
Mortgage History
| Date | Status | Borrower | Loan Amount |
|---|---|---|---|
| Open | Dagy Sharon M | $81,000 |
Source: Public Records
Tax History Compared to Growth
Tax History
| Year | Tax Paid | Tax Assessment Tax Assessment Total Assessment is a certain percentage of the fair market value that is determined by local assessors to be the total taxable value of land and additions on the property. | Land | Improvement |
|---|---|---|---|---|
| 2024 | $3,032 | $49,035 | $10,500 | $38,535 |
| 2023 | $2,632 | $36,410 | $9,280 | $27,130 |
| 2022 | $2,606 | $36,400 | $9,280 | $27,130 |
| 2021 | $2,679 | $36,400 | $9,280 | $27,130 |
| 2020 | $2,350 | $28,000 | $7,140 | $20,860 |
| 2019 | $2,245 | $80,000 | $20,400 | $59,600 |
| 2018 | $2,162 | $28,000 | $7,140 | $20,860 |
| 2017 | $2,226 | $25,800 | $5,530 | $20,270 |
| 2016 | $2,213 | $25,800 | $5,530 | $20,270 |
| 2015 | $2,099 | $25,800 | $5,530 | $20,270 |
| 2014 | $2,099 | $26,330 | $5,640 | $20,690 |
Source: Public Records
Map
Nearby Homes
- 5603 Allanwood Dr
- 5815 Wilber Ave
- 5415 Pelham Dr
- 4710 Maplecrest Ave
- 6189 W 54th St
- 4802 Grantwood Dr
- 5205 Woodrow Ave
- 6708 Thornton Dr
- 6610 Renwood Dr
- 6021 Snow Rd
- 6704 Charles Ave
- 6406 Sunderland Dr
- 6818 Hampstead Ave
- 4507 Grantwood Dr
- 6096 Wareham Dr
- 4424 Forestwood Dr
- 7014 Thornton Dr
- 6706 Alber Ave
- 6111 Manchester Rd
- 6903 Alber Ave
- 5506 Haverhill Ave
- 5414 Haverhill Ave
- 5510 Haverhill Ave
- 5514 Haverhill Ave
- 5503 Allanwood Dr
- 5406 Haverhill Ave
- 6020 W 54th St
- 5507 Allanwood Dr
- 5415 Allanwood Dr
- 6016 W 54th St
- 5511 Allanwood Dr
- 5602 Haverhill Ave
- 6010 W 54th St
- 5515 Allanwood Dr
- 5503 Haverhill Ave
- 5411 Haverhill Ave
- 6040 W 54th St
- 5511 Haverhill Ave
- 5606 Haverhill Ave
- 6006 W 54th St