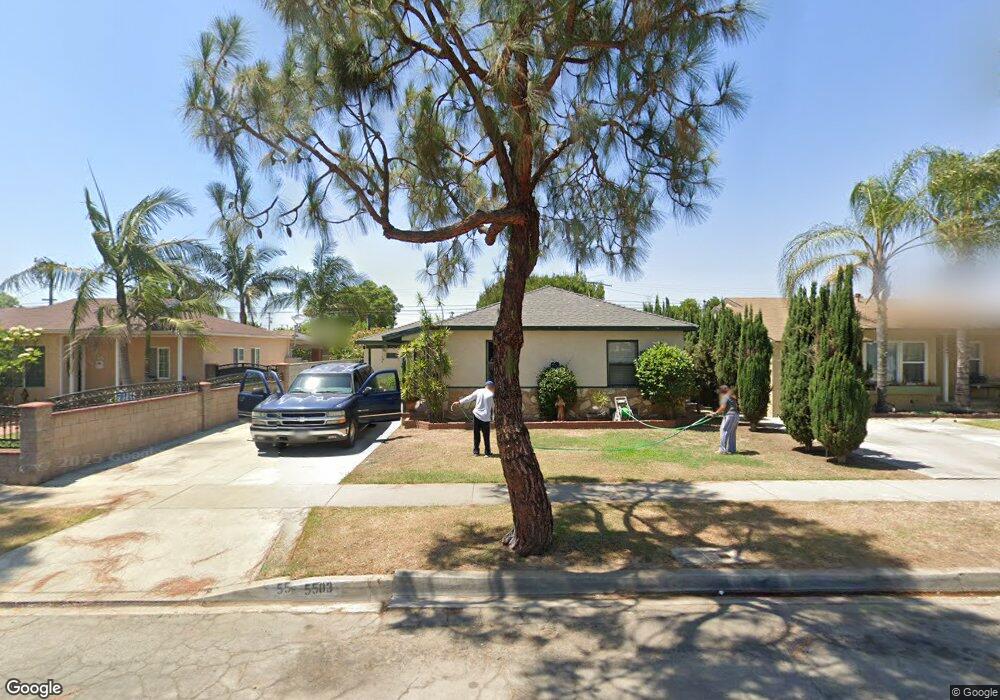
5503 Bridgeview Ave Pico Rivera, CA 90660
Estimated Value: $665,550 - $731,000
2
Beds
1
Bath
1,032
Sq Ft
$676/Sq Ft
Est. Value
About This Home
This home is located at 5503 Bridgeview Ave, Pico Rivera, CA 90660 and is currently estimated at $698,138, approximately $676 per square foot. 5503 Bridgeview Ave is a home located in Los Angeles County with nearby schools including Rio Vista Elementary School, Ruben Salazar Continuation School, and El Rancho High School.
Ownership History
Date
Name
Owned For
Owner Type
Purchase Details
Closed on
Mar 15, 2017
Sold by
Ramirez Maria M
Bought by
Ramirez Maria M
Current Estimated Value
Purchase Details
Closed on
Mar 6, 2003
Sold by
Ramirez Maria M
Bought by
Ramirez Maria M
Purchase Details
Closed on
Jul 12, 1999
Sold by
Ramirez Maria M
Bought by
Ramirez Maria M
Home Financials for this Owner
Home Financials are based on the most recent Mortgage that was taken out on this home.
Original Mortgage
$35,000
Interest Rate
7.51%
Mortgage Type
Stand Alone Second
Purchase Details
Closed on
Dec 14, 1993
Sold by
Ramirez Maria M
Bought by
Ramirez Maria M
Home Financials for this Owner
Home Financials are based on the most recent Mortgage that was taken out on this home.
Original Mortgage
$133,200
Interest Rate
7.2%
Create a Home Valuation Report for This Property
The Home Valuation Report is an in-depth analysis detailing your home's value as well as a comparison with similar homes in the area
Home Values in the Area
Average Home Value in this Area
Purchase History
| Date | Buyer | Sale Price | Title Company |
|---|---|---|---|
| Ramirez Maria M | -- | None Available | |
| Ramirez Maria M | -- | -- | |
| Ramirez Maria M | -- | North American Title Co | |
| Ramirez Maria M | -- | Southland Title |
Source: Public Records
Mortgage History
| Date | Status | Borrower | Loan Amount |
|---|---|---|---|
| Closed | Ramirez Maria M | $35,000 | |
| Closed | Ramirez Maria M | $133,200 |
Source: Public Records
Tax History
| Year | Tax Paid | Tax Assessment Tax Assessment Total Assessment is a certain percentage of the fair market value that is determined by local assessors to be the total taxable value of land and additions on the property. | Land | Improvement |
|---|---|---|---|---|
| 2025 | $4,105 | $272,250 | $217,077 | $55,173 |
| 2024 | $4,105 | $266,913 | $212,821 | $54,092 |
| 2023 | $3,992 | $261,681 | $208,649 | $53,032 |
| 2022 | $3,815 | $256,551 | $204,558 | $51,993 |
| 2021 | $3,706 | $251,522 | $200,548 | $50,974 |
| 2019 | $3,676 | $244,063 | $194,600 | $49,463 |
| 2018 | $3,458 | $239,279 | $190,785 | $48,494 |
| 2016 | $3,129 | $229,990 | $183,378 | $46,612 |
| 2015 | $3,082 | $226,536 | $180,624 | $45,912 |
| 2014 | $3,046 | $222,099 | $177,086 | $45,013 |
Source: Public Records
Map
Nearby Homes
- 5313 Manzanar Ave
- 5259 Calico Ave
- 9203 Loch Lomond Dr
- 5101 Lindsey Ave
- 9324 Rosehedge Dr
- 4918 Rosemead Blvd
- 9243 Balfour St
- 9035 Hightree St
- 6449 Triton Dr
- 9514 Bradhurst St
- 6651 Via Vista
- 6650 Via Vista
- 6630 Via Vista
- 6648 Via Vista
- 9530 Underwood St
- 4660 Paramount Blvd
- 8630 Elba St
- 4753 Orange St
- 9318 Via Azul
- 9327 Via Azul
- 5509 Bridgeview Ave
- 5447 Bridgeview Ave
- 5515 Bridgeview Ave
- 5441 Bridgeview Ave
- 5502 Zola Ave
- 5506 Zola Ave
- 5448 Zola Ave
- 5512 Zola Ave
- 5519 Bridgeview Ave
- 5437 Bridgeview Ave
- 5518 Zola Ave
- 5502 Bridgeview Ave
- 5508 Bridgeview Ave
- 5446 Bridgeview Ave
- 5512 Bridgeview Ave
- 5525 Bridgeview Ave
- 5433 Bridgeview Ave
- 5522 Zola Ave
- 5440 Bridgeview Ave
- 5516 Bridgeview Ave
Your Personal Tour Guide
Ask me questions while you tour the home.