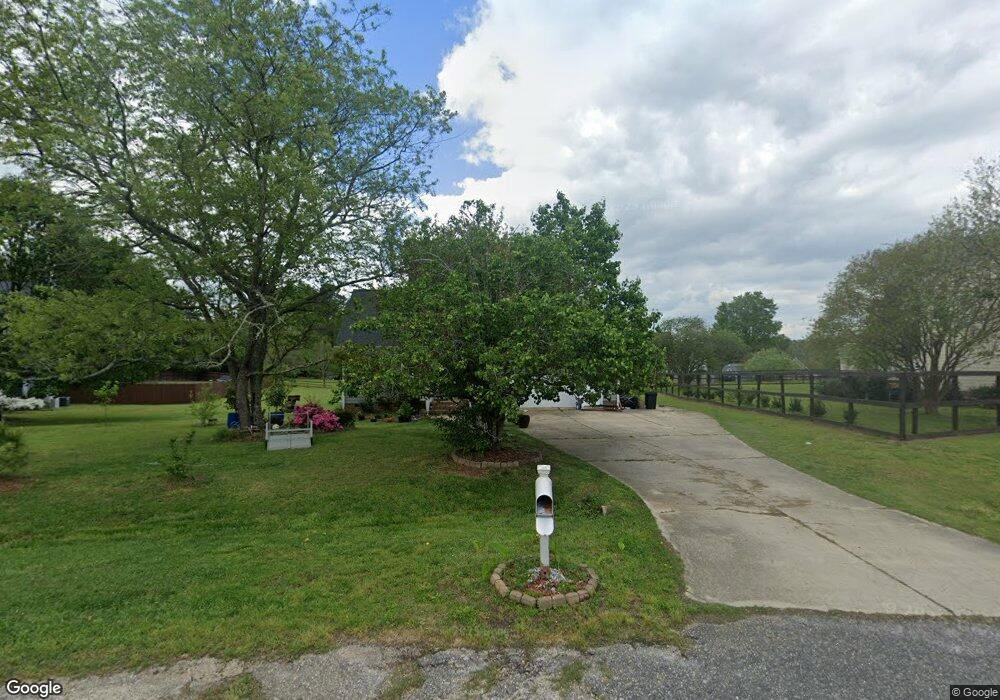
5504 Havenhurst Ct Raleigh, NC 27603
Estimated Value: $387,000 - $463,000
3
Beds
3
Baths
1,958
Sq Ft
$212/Sq Ft
Est. Value
About This Home
This home is located at 5504 Havenhurst Ct, Raleigh, NC 27603 and is currently estimated at $415,713, approximately $212 per square foot. 5504 Havenhurst Ct is a home located in Wake County with nearby schools including Vance Elementary School, North Garner Middle, and Garner High.
Ownership History
Date
Name
Owned For
Owner Type
Purchase Details
Closed on
Oct 8, 2020
Sold by
Mestayer Marc and Mestayer Stephanie
Bought by
Tojil Carlos Vinicio Lopez and Perez Nemesia Tomasa
Current Estimated Value
Home Financials for this Owner
Home Financials are based on the most recent Mortgage that was taken out on this home.
Original Mortgage
$208,800
Outstanding Balance
$193,357
Interest Rate
5.5%
Mortgage Type
New Conventional
Estimated Equity
$222,356
Purchase Details
Closed on
Mar 31, 2017
Sold by
Mestayer Sharon
Bought by
Mestayer Marc
Home Financials for this Owner
Home Financials are based on the most recent Mortgage that was taken out on this home.
Original Mortgage
$68,500
Interest Rate
4.1%
Mortgage Type
New Conventional
Purchase Details
Closed on
Mar 29, 1996
Bought by
Mestayer Marc A and Mestayer Sharon P
Create a Home Valuation Report for This Property
The Home Valuation Report is an in-depth analysis detailing your home's value as well as a comparison with similar homes in the area
Home Values in the Area
Average Home Value in this Area
Purchase History
| Date | Buyer | Sale Price | Title Company |
|---|---|---|---|
| Tojil Carlos Vinicio Lopez | $261,000 | None Available | |
| Mestayer Marc | -- | None Available | |
| Mestayer Marc A | $149,000 | -- |
Source: Public Records
Mortgage History
| Date | Status | Borrower | Loan Amount |
|---|---|---|---|
| Open | Tojil Carlos Vinicio Lopez | $208,800 | |
| Previous Owner | Mestayer Marc | $68,500 |
Source: Public Records
Tax History Compared to Growth
Tax History
| Year | Tax Paid | Tax Assessment Tax Assessment Total Assessment is a certain percentage of the fair market value that is determined by local assessors to be the total taxable value of land and additions on the property. | Land | Improvement |
|---|---|---|---|---|
| 2025 | $2,682 | $416,159 | $100,000 | $316,159 |
| 2024 | $2,604 | $416,159 | $100,000 | $316,159 |
| 2023 | $1,978 | $251,139 | $46,000 | $205,139 |
| 2022 | $1,834 | $251,139 | $46,000 | $205,139 |
| 2021 | $1,785 | $251,139 | $46,000 | $205,139 |
| 2020 | $1,755 | $251,139 | $46,000 | $205,139 |
| 2019 | $1,651 | $199,716 | $45,000 | $154,716 |
| 2018 | $1,519 | $199,716 | $45,000 | $154,716 |
| 2017 | $1,440 | $199,716 | $45,000 | $154,716 |
| 2016 | $1,411 | $199,716 | $45,000 | $154,716 |
| 2015 | $1,339 | $189,971 | $40,000 | $149,971 |
| 2014 | $1,270 | $189,971 | $40,000 | $149,971 |
Source: Public Records
Map
Nearby Homes
- 1005 Turner Meadow Dr
- 5512 Glenhurst Dr N
- 1220 Turner Woods Dr
- 2400 Trueway Ln
- 1017 Widgeon Way
- 2817 Buckboard Ln
- 1200 Misty Morning Way
- 936 Elbridge Dr
- 2704 Stageline Dr
- 5216 Relay Way
- 449 Kings Hollow Dr
- 6024 Lunenburg Dr
- 1009 Feldmen Dr
- 6521 Camellia Creek Dr
- 1017 Azalea Garden Cir
- 1025 Azalea Garden Cir
- 2600 Banks Rd Unit Lot 2
- 2600 Banks Rd Unit Lot 1
- 1033 Azalea Garden Cir
- 1037 Azalea Garden Cir
- 5504 Haven Hurst Ct
- 5508 Haven Hurst Ct
- 5508 Havenhurst Ct
- 5500 Haven Hurst Ct
- 5505 Haven Hill Ct
- 5509 Haven Hill Ct
- 5512 Havenhurst Ct
- 5512 Haven Hurst Ct
- 5501 Haven Hill Ct
- 1000 Turner Meadow Dr
- 805 Broadhaven Dr
- 1008 Turner Meadow Dr
- 5512 Haven Hill Ct
- 0 Haven Hill Ct
- 5505 Havenhurst Ct
- 5505 Haven Hurst Ct
- 5509 Havenhurst Ct
- 5509 Haven Hurst Ct
- 5701 Turner Store Ln
- 5700 Turner Store Ln