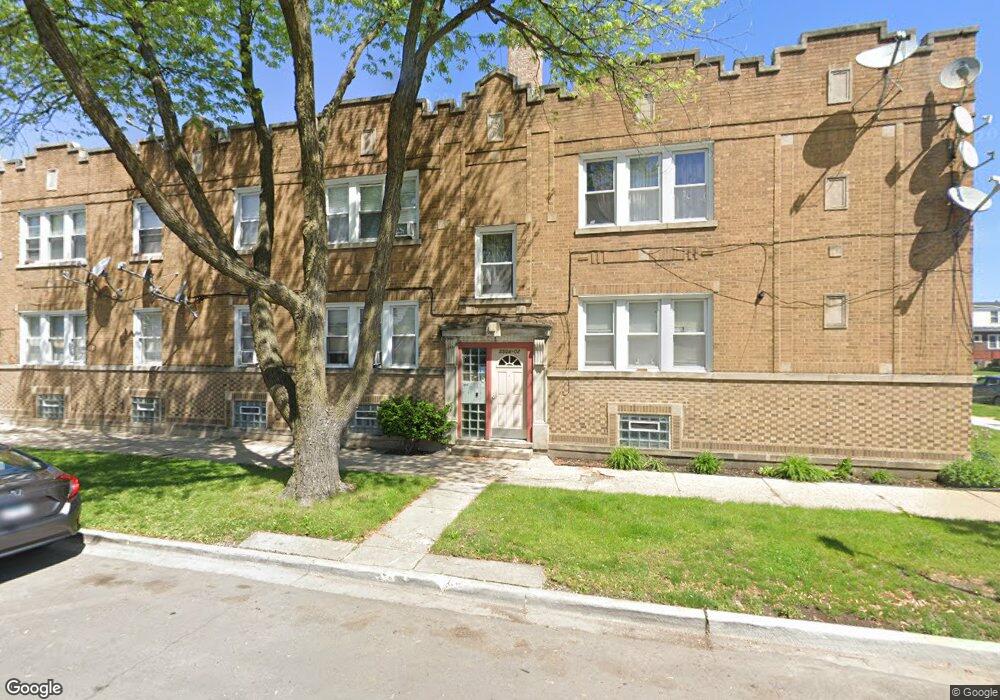
5504 W Barry Ave Unit 55042 Chicago, IL 60641
Cragin NeighborhoodEstimated Value: $118,000 - $141,000
1
Bed
1
Bath
11,536
Sq Ft
$12/Sq Ft
Est. Value
About This Home
This home is located at 5504 W Barry Ave Unit 55042, Chicago, IL 60641 and is currently estimated at $132,706, approximately $11 per square foot. 5504 W Barry Ave Unit 55042 is a home located in Cook County with nearby schools including Camras Elementary School, Foreman College and Career Academy, and St Ferdinand Parish School.
Ownership History
Date
Name
Owned For
Owner Type
Purchase Details
Closed on
Mar 12, 2024
Sold by
Korzeniewski Patryk and Korzeniewski Marjorie
Bought by
Najafi Tohid and Niknezhad Seyedehogol
Current Estimated Value
Home Financials for this Owner
Home Financials are based on the most recent Mortgage that was taken out on this home.
Original Mortgage
$91,500
Outstanding Balance
$90,180
Interest Rate
7.38%
Mortgage Type
New Conventional
Estimated Equity
$42,526
Purchase Details
Closed on
Jan 29, 2019
Sold by
Bosiak Franciszek
Bought by
Korzeniewski Patryk
Purchase Details
Closed on
Dec 18, 2008
Sold by
Bosiak Franciszek
Bought by
Bosiak Franciszek and Franciszek Bosiak Trust
Purchase Details
Closed on
Aug 10, 2005
Sold by
Barry Street Development Llc
Bought by
Bosiak Franciszek
Create a Home Valuation Report for This Property
The Home Valuation Report is an in-depth analysis detailing your home's value as well as a comparison with similar homes in the area
Home Values in the Area
Average Home Value in this Area
Purchase History
| Date | Buyer | Sale Price | Title Company |
|---|---|---|---|
| Najafi Tohid | $122,000 | Saturn Title | |
| Korzeniewski Patryk | $15,000 | Advisors Title Network Llc | |
| Bosiak Franciszek | -- | None Available | |
| Bosiak Franciszek | $129,000 | Cti |
Source: Public Records
Mortgage History
| Date | Status | Borrower | Loan Amount |
|---|---|---|---|
| Open | Najafi Tohid | $91,500 |
Source: Public Records
Tax History Compared to Growth
Tax History
| Year | Tax Paid | Tax Assessment Tax Assessment Total Assessment is a certain percentage of the fair market value that is determined by local assessors to be the total taxable value of land and additions on the property. | Land | Improvement |
|---|---|---|---|---|
| 2024 | $1,769 | $9,550 | $1,047 | $8,503 |
| 2023 | $1,724 | $8,386 | $849 | $7,537 |
| 2022 | $1,724 | $8,386 | $849 | $7,537 |
| 2021 | $1,686 | $8,384 | $848 | $7,536 |
| 2020 | $1,636 | $7,346 | $707 | $6,639 |
| 2019 | $1,665 | $8,285 | $707 | $7,578 |
| 2018 | $1,637 | $8,285 | $707 | $7,578 |
| 2017 | $16 | $6,828 | $622 | $6,206 |
| 2016 | $444 | $6,828 | $622 | $6,206 |
| 2015 | $427 | $6,828 | $622 | $6,206 |
| 2014 | $875 | $9,336 | $594 | $8,742 |
| 2013 | $878 | $9,336 | $594 | $8,742 |
Source: Public Records
Map
Nearby Homes
- 3036 N Luna Ave
- 3036 N Long Ave
- 5435 W Melrose St
- 2939 N Lotus Ave
- 5244 W Barry Ave
- 2859 N Mango Ave
- 5243 W Oakdale Ave
- 5303 W George St
- 3043 N Laramie Ave Unit 2
- 3045 N Laramie Ave Unit 2
- 5254 W Wolfram St
- 5505 W Parker Ave
- 5529 W Cornelia Ave
- 3450 N Central Ave
- 5736 W Roscoe St
- 3454 N Central Ave
- 4918-22 W Diversey Ave
- 5631 W Cornelia Ave
- 2735 N Mango Ave
- 5254 W Newport Ave
- 5504 W Barry Ave Unit 2
- 5510 W Barry Ave Unit 55102
- 5510 W Barry Ave Unit 55101
- 5502 W Barry Ave Unit 55022
- 5504 W Barry Ave Unit 55041
- 5502 W Barry Ave Unit 55021
- 5502 W Barry Ave Unit 1
- 5510 W Barry Ave Unit 2
- 5510 W Barry Ave Unit 1
- 3104 N Linder Ave Unit 12
- 5508 W Barry Ave Unit 55082
- 5508 W Barry Ave Unit 55081
- 5508 W Barry Ave Unit 1
- 5508 W Barry Ave Unit 2
- 5508 W Barry Ave
- 3108 N Linder Ave
- 3110 N Linder Ave
- 3058 N Linder Ave
- 3112 N Linder Ave
- 5518 W Barry Ave