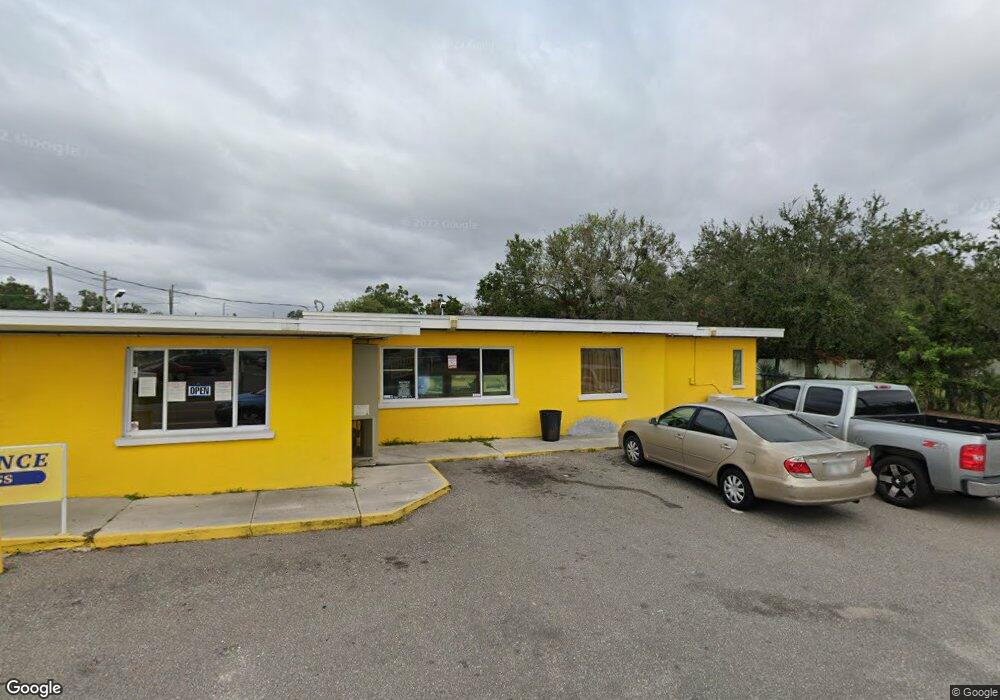
5505 15th St E Bradenton, FL 34203
Oneco NeighborhoodEstimated Value: $344,241
Studio
1
Bath
1,609
Sq Ft
$214/Sq Ft
Est. Value
About This Home
This home is located at 5505 15th St E, Bradenton, FL 34203 and is currently estimated at $344,241, approximately $213 per square foot. 5505 15th St E is a home located in Manatee County with nearby schools including Oneco Elementary School, W. D. Sugg Middle School, and Southeast High School.
Ownership History
Date
Name
Owned For
Owner Type
Purchase Details
Closed on
Aug 22, 2016
Sold by
Herring And Shimmell Inc
Bought by
Cordero Insurance Agency Inc
Current Estimated Value
Home Financials for this Owner
Home Financials are based on the most recent Mortgage that was taken out on this home.
Original Mortgage
$164,000
Outstanding Balance
$129,655
Interest Rate
3.45%
Mortgage Type
Future Advance Clause Open End Mortgage
Estimated Equity
$214,586
Purchase Details
Closed on
Mar 12, 2009
Sold by
Shimmell Thomas N
Bought by
Herring & Shimmell Inc
Purchase Details
Closed on
Jan 27, 2009
Sold by
Herring Hugh R and Herring & Shimmell Inc
Bought by
Shimmell Thomas N
Purchase Details
Closed on
May 15, 2000
Sold by
Bascom Lucinda Malnati and Malnati Catherine S
Bought by
Herring & Shimmell Inc
Home Financials for this Owner
Home Financials are based on the most recent Mortgage that was taken out on this home.
Original Mortgage
$73,000
Interest Rate
8.2%
Mortgage Type
Commercial
Create a Home Valuation Report for This Property
The Home Valuation Report is an in-depth analysis detailing your home's value as well as a comparison with similar homes in the area
Home Values in the Area
Average Home Value in this Area
Purchase History
| Date | Buyer | Sale Price | Title Company |
|---|---|---|---|
| Cordero Insurance Agency Inc | $205,000 | Barnes Walker Title Inc | |
| Herring & Shimmell Inc | -- | None Available | |
| Shimmell Thomas N | -- | Attorney | |
| Herring & Shimmell Inc | $85,000 | -- |
Source: Public Records
Mortgage History
| Date | Status | Borrower | Loan Amount |
|---|---|---|---|
| Open | Cordero Insurance Agency Inc | $164,000 | |
| Previous Owner | Herring & Shimmell Inc | $73,000 |
Source: Public Records
Tax History
| Year | Tax Paid | Tax Assessment Tax Assessment Total Assessment is a certain percentage of the fair market value that is determined by local assessors to be the total taxable value of land and additions on the property. | Land | Improvement |
|---|---|---|---|---|
| 2025 | $3,661 | $208,416 | $79,263 | $129,153 |
| 2023 | $3,749 | $210,463 | $78,880 | $131,583 |
| 2022 | $3,569 | $199,338 | $75,600 | $123,738 |
| 2021 | $3,324 | $188,011 | $75,600 | $112,411 |
| 2020 | $3,444 | $187,246 | $69,300 | $117,946 |
| 2019 | $3,450 | $186,942 | $69,300 | $117,642 |
| 2018 | $3,349 | $179,854 | $73,964 | $105,890 |
| 2017 | $3,191 | $179,493 | $0 | $0 |
| 2016 | $2,336 | $122,173 | $0 | $0 |
Source: Public Records
Map
Nearby Homes
- 1020 301 Blvd E
- 1313 54th Ave E Unit 1313
- 5207 15th Street Ct E
- 5223 17th Street Ct E
- 5409 18th Street Blvd E
- 5322 11th Street Cir E Unit 28
- 5723 12th St E
- 5406 11th Street Cir E
- 5105 15th Street Ct E
- 5128 18th Ln E
- 5268 11th St E
- 1625 51st Ave E
- 1219 51st Ave E Unit 148
- 1219 51st Ave E Unit 9
- 1219 51st Ave E Unit 176
- 1219 51st Ave E Unit 164
- 1219 51st Ave E Unit 103
- 1219 51st Ave E Unit Lot 24
- 1219 51st Ave E Unit 18
- 1219 51st Ave E Unit 76
- 0 55th Ave Unit U7573081
- 5425 15th St E
- 5434 16th St E
- 5423 15th St E
- 5430 16th St E
- 5421 15th St E
- 5426 16th St E
- 5422 16th St E
- 5415 15th St E
- 1334 54th Avenue Dr E
- 5427 16th St E
- 5418 16th St E
- 1332 54th Avenue Dr E
- 5425 16th St E
- 5425 16th St E
- 1330 54th Avenue Dr E
- 5423 16th St E
- 1328 54th Avenue Dr E
- 1328 54th Avenue Dr E Unit 1-D
- 1328 54th Avenue Dr E Unit 17A
Your Personal Tour Guide
Ask me questions while you tour the home.