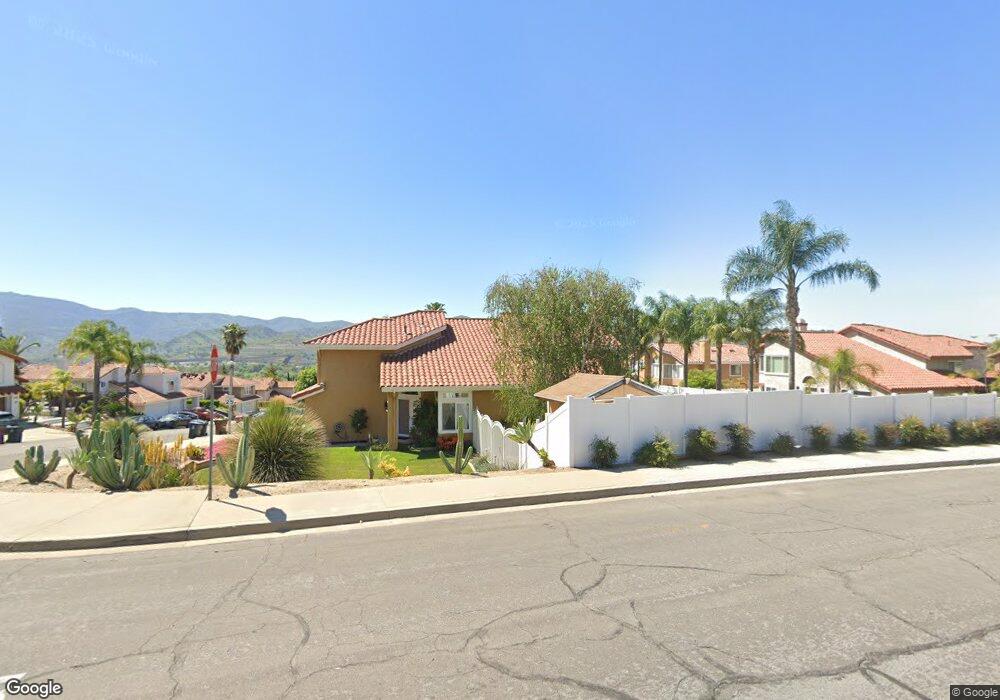
5505 Via Cantada Yorba Linda, CA 92887
Estimated Value: $1,387,000 - $1,555,000
4
Beds
3
Baths
2,599
Sq Ft
$564/Sq Ft
Est. Value
About This Home
This home is located at 5505 Via Cantada, Yorba Linda, CA 92887 and is currently estimated at $1,464,773, approximately $563 per square foot. 5505 Via Cantada is a home located in Orange County with nearby schools including Bryant Ranch Elementary School, Travis Ranch Middle School, and Yorba Linda High School.
Ownership History
Date
Name
Owned For
Owner Type
Purchase Details
Closed on
Aug 28, 2020
Sold by
Haynes Richard Allan and Haynes Heather Dawn
Bought by
Haynes Richard Allan and Haynes Heather Dawn
Current Estimated Value
Purchase Details
Closed on
May 23, 2001
Sold by
Haynes Richard A
Bought by
Haynes Richard A and Haynes Heather
Home Financials for this Owner
Home Financials are based on the most recent Mortgage that was taken out on this home.
Original Mortgage
$232,000
Outstanding Balance
$87,334
Interest Rate
7.14%
Estimated Equity
$1,377,439
Purchase Details
Closed on
May 1, 1998
Sold by
Hart Robin A
Bought by
Haynes Richard A
Home Financials for this Owner
Home Financials are based on the most recent Mortgage that was taken out on this home.
Original Mortgage
$155,000
Interest Rate
7.13%
Purchase Details
Closed on
Aug 6, 1993
Sold by
Schmitz Gregory J and Schmitz Yvonne G
Bought by
Hart Robin A
Create a Home Valuation Report for This Property
The Home Valuation Report is an in-depth analysis detailing your home's value as well as a comparison with similar homes in the area
Home Values in the Area
Average Home Value in this Area
Purchase History
| Date | Buyer | Sale Price | Title Company |
|---|---|---|---|
| Haynes Richard Allan | -- | None Available | |
| Haynes Richard Allan | -- | None Available | |
| Haynes Richard A | -- | Fidelity National Title Ins | |
| Haynes Richard A | $285,000 | Fidelity National Title Ins | |
| Haynes Richard A | -- | Fidelity National Title Ins | |
| Hart Robin A | $310,000 | South Coast Title Company |
Source: Public Records
Mortgage History
| Date | Status | Borrower | Loan Amount |
|---|---|---|---|
| Open | Haynes Richard A | $232,000 | |
| Closed | Haynes Richard A | $155,000 |
Source: Public Records
Tax History Compared to Growth
Tax History
| Year | Tax Paid | Tax Assessment Tax Assessment Total Assessment is a certain percentage of the fair market value that is determined by local assessors to be the total taxable value of land and additions on the property. | Land | Improvement |
|---|---|---|---|---|
| 2025 | $5,890 | $473,902 | $147,263 | $326,639 |
| 2024 | $5,890 | $464,610 | $144,375 | $320,235 |
| 2023 | $5,769 | $455,500 | $141,544 | $313,956 |
| 2022 | $5,681 | $446,569 | $138,769 | $307,800 |
| 2021 | $5,563 | $437,813 | $136,048 | $301,765 |
| 2020 | $5,446 | $433,324 | $134,653 | $298,671 |
| 2019 | $5,268 | $424,828 | $132,013 | $292,815 |
| 2018 | $5,216 | $416,499 | $129,425 | $287,074 |
| 2017 | $5,125 | $408,333 | $126,887 | $281,446 |
| 2016 | $4,989 | $400,327 | $124,399 | $275,928 |
| 2015 | $4,953 | $394,314 | $122,530 | $271,784 |
| 2014 | $4,793 | $386,590 | $120,129 | $266,461 |
Source: Public Records
Map
Nearby Homes
- 5420 Los Monteros
- 5527 Patricia Way
- 23985 Nicole Way Unit 31
- 23964 Old Pomegranate Rd
- 23556 Cambridge Rd Unit 327
- 6210 Hartford Rd Unit 201
- 23502 Cambridge Rd Unit 306
- 23482 Cambridge Rd Unit 294
- 27870 Tamara Dr
- 5920 Bedford Ct Unit 137
- 6205 Plymouth Ct Unit 113
- 6211 Newhaven Ct Unit 128
- 24370 La Homa
- 6040 Vermont Ct Unit 80
- 25511 Palermo Way
- 23330 Dover Ln Unit 94
- 5150 Avenida de Despacio
- 23160 Newport Ln Unit 9
- 25540 Aragon Way
- 0 Meadow Land Dr
- 5515 Via Cantada
- 5500 Via Vallarta
- 5510 Via Vallarta
- 5525 Via Cantada
- 24667 Via Melinda
- 5510 Via Cantada
- 24665 Via Melinda
- 5520 Via Vallarta
- 24670 Paseo de Toronto
- 5520 Vía Vallarta
- 5520 Via Cantada
- 5535 Via Cantada
- 24663 Via Melinda
- 5505 Via Vallarta
- 5530 Via Cantada
- 5530 Via Vallarta
- 5515 Via Vallarta
- 24661 Via Melinda
- 24674 Paseo de Toronto
- 5545 Via Cantada