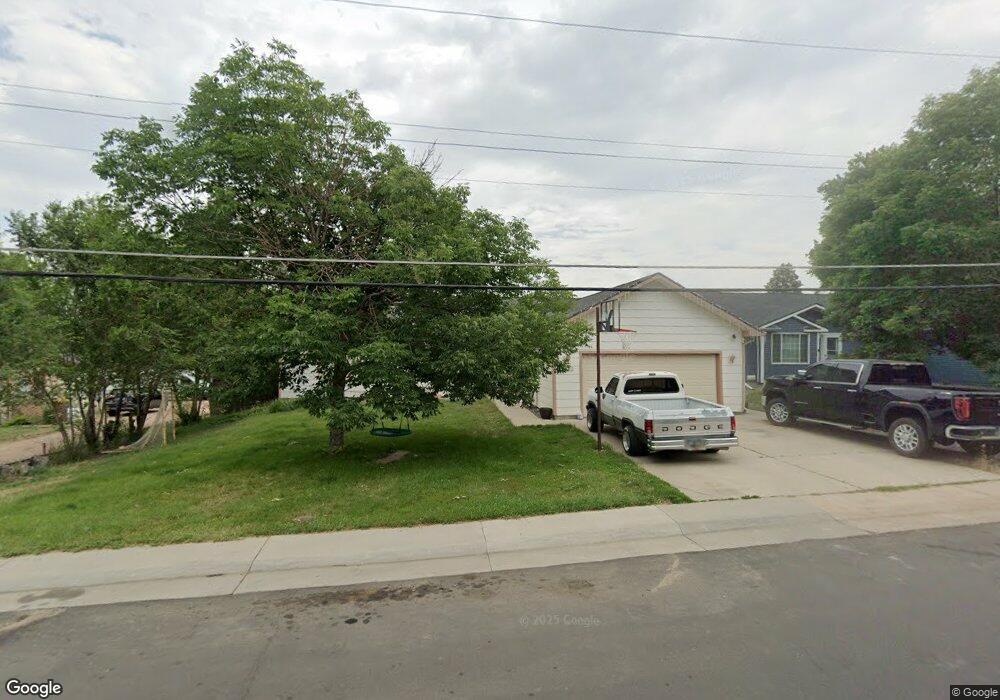
5506 Tejon St Denver, CO 80221
Berkley NeighborhoodEstimated Value: $477,000 - $508,000
3
Beds
2
Baths
1,512
Sq Ft
$323/Sq Ft
Est. Value
About This Home
This home is located at 5506 Tejon St, Denver, CO 80221 and is currently estimated at $488,333, approximately $322 per square foot. 5506 Tejon St is a home located in Adams County with nearby schools including Colorado Sports Leadership Academy, Josephine Hodgkins Leadership Academy, and Westminster High School.
Ownership History
Date
Name
Owned For
Owner Type
Purchase Details
Closed on
Jan 15, 2014
Sold by
Nguyen Ngoc Thi
Bought by
Th Property Rental Llc
Current Estimated Value
Purchase Details
Closed on
Jan 11, 2011
Sold by
Nguyen Dao Thi
Bought by
Nguyen Ngoc Thi
Purchase Details
Closed on
Jan 16, 2006
Sold by
Novastar Mortgage Inc
Bought by
Nguyen Dao T
Purchase Details
Closed on
Nov 10, 2005
Sold by
Ly Robert
Bought by
Dao Nguyen Thi
Purchase Details
Closed on
Oct 24, 2005
Sold by
Cano Gusbeth
Bought by
Novastar Mortgage Inc
Purchase Details
Closed on
Oct 12, 2005
Sold by
Cano Gusbeth
Bought by
Ly Robert
Purchase Details
Closed on
Jan 10, 2003
Sold by
Horizon Homes Llc
Bought by
Cano Gusbeth
Home Financials for this Owner
Home Financials are based on the most recent Mortgage that was taken out on this home.
Original Mortgage
$160,000
Interest Rate
6.99%
Create a Home Valuation Report for This Property
The Home Valuation Report is an in-depth analysis detailing your home's value as well as a comparison with similar homes in the area
Home Values in the Area
Average Home Value in this Area
Purchase History
| Date | Buyer | Sale Price | Title Company |
|---|---|---|---|
| Th Property Rental Llc | -- | None Available | |
| Nguyen Ngoc Thi | -- | None Available | |
| Nguyen Dao T | $170,000 | Security Title | |
| Dao Nguyen Thi | -- | -- | |
| Novastar Mortgage Inc | -- | -- | |
| Ly Robert | -- | -- | |
| Cano Gusbeth | $200,000 | -- |
Source: Public Records
Mortgage History
| Date | Status | Borrower | Loan Amount |
|---|---|---|---|
| Previous Owner | Cano Gusbeth | $160,000 |
Source: Public Records
Tax History Compared to Growth
Tax History
| Year | Tax Paid | Tax Assessment Tax Assessment Total Assessment is a certain percentage of the fair market value that is determined by local assessors to be the total taxable value of land and additions on the property. | Land | Improvement |
|---|---|---|---|---|
| 2024 | $3,610 | $32,320 | $7,190 | $25,130 |
| 2023 | $3,597 | $35,310 | $7,780 | $27,530 |
| 2022 | $2,968 | $24,480 | $7,990 | $16,490 |
| 2021 | $3,037 | $24,480 | $7,990 | $16,490 |
| 2020 | $2,899 | $23,690 | $8,080 | $15,610 |
| 2019 | $2,925 | $23,690 | $8,080 | $15,610 |
| 2018 | $2,356 | $19,070 | $4,900 | $14,170 |
| 2017 | $2,089 | $19,070 | $4,900 | $14,170 |
| 2016 | $1,606 | $13,950 | $3,020 | $10,930 |
| 2015 | $1,600 | $13,950 | $3,020 | $10,930 |
| 2014 | $1,410 | $11,760 | $2,790 | $8,970 |
Source: Public Records
Map
Nearby Homes
- 5532 Umatilla St
- 5540 Vallejo St
- 2196 W 56th Ave
- 5480 Raritan Way
- 1741 W 55th Place
- 5445 Vallejo St
- 5401 Raritan Way
- 5515 Zuni St
- 1771 W 53rd Place Unit 1
- 5335 Pecos Way Unit 4
- 5678 Alcott St
- 5688 Alcott St
- 1949 W 52nd Place
- 2543 W 54th Ave
- 5635 Bryant St
- 2551 W 58th Ave
- 5774 Clay St
- 5425 Clay St
- 2541 W 52nd Ave
- 5185 Alcott St
- 5502 Tejon St
- 5510 Tejon St
- 5511 Shoshone St
- 5484 Tejon St
- 5501 Shoshone St
- 5516 Tejon St
- 5521 Shoshone St
- 5513 Tejon St
- 5483 Shoshone St
- 5501 Tejon St
- 5531 Shoshone St
- 5474 Tejon St
- 5535 Tejon St
- 5540 Tejon St
- 5485 Tejon St
- 5473 Shoshone St
- 5551 Tejon St
- 5541 Shoshone St
- 5560 Tejon St
- 5464 Tejon St