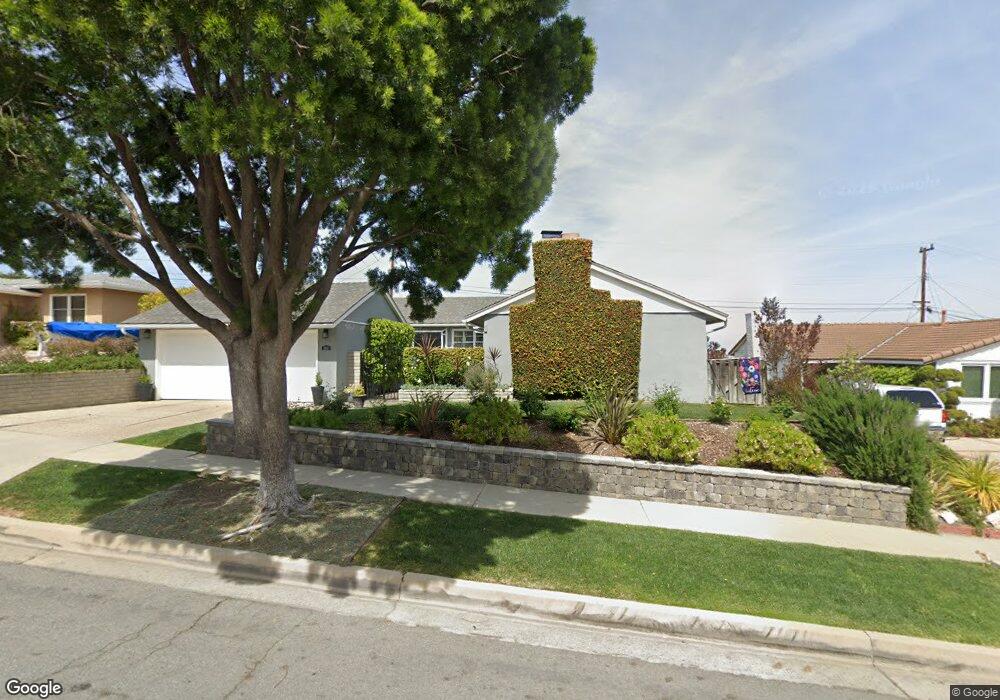
5507 Bayridge Rd Rancho Palos Verdes, CA 90275
Estimated Value: $1,716,843 - $1,906,000
3
Beds
2
Baths
1,773
Sq Ft
$1,016/Sq Ft
Est. Value
About This Home
This home is located at 5507 Bayridge Rd, Rancho Palos Verdes, CA 90275 and is currently estimated at $1,800,961, approximately $1,015 per square foot. 5507 Bayridge Rd is a home located in Los Angeles County with nearby schools including Silver Spur Elementary School, Palos Verdes Intermediate School, and Palos Verdes Peninsula High School.
Ownership History
Date
Name
Owned For
Owner Type
Purchase Details
Closed on
Jan 12, 2018
Sold by
Jolls Andrew William
Bought by
Jolls Andrew William and Jolls Melissa Christine
Current Estimated Value
Home Financials for this Owner
Home Financials are based on the most recent Mortgage that was taken out on this home.
Original Mortgage
$250,000
Outstanding Balance
$210,916
Interest Rate
3.93%
Mortgage Type
Credit Line Revolving
Estimated Equity
$1,590,045
Purchase Details
Closed on
Aug 31, 2011
Sold by
Scholton Sanford G
Bought by
Jolis Andrew and Jolis Melissa
Home Financials for this Owner
Home Financials are based on the most recent Mortgage that was taken out on this home.
Original Mortgage
$508,300
Interest Rate
4.02%
Mortgage Type
New Conventional
Purchase Details
Closed on
Mar 7, 1996
Sold by
Goppert Jean G
Bought by
Goppert Jean G and Goppert Yvonne
Create a Home Valuation Report for This Property
The Home Valuation Report is an in-depth analysis detailing your home's value as well as a comparison with similar homes in the area
Home Values in the Area
Average Home Value in this Area
Purchase History
| Date | Buyer | Sale Price | Title Company |
|---|---|---|---|
| Jolls Andrew William | -- | First American Title Company | |
| Jolis Andrew | $782,000 | Fidelity National Title Co | |
| Goppert Jean G | -- | -- |
Source: Public Records
Mortgage History
| Date | Status | Borrower | Loan Amount |
|---|---|---|---|
| Open | Jolls Andrew William | $250,000 | |
| Previous Owner | Jolis Andrew | $508,300 |
Source: Public Records
Tax History Compared to Growth
Tax History
| Year | Tax Paid | Tax Assessment Tax Assessment Total Assessment is a certain percentage of the fair market value that is determined by local assessors to be the total taxable value of land and additions on the property. | Land | Improvement |
|---|---|---|---|---|
| 2025 | $11,434 | $982,224 | $785,784 | $196,440 |
| 2024 | $11,434 | $962,966 | $770,377 | $192,589 |
| 2023 | $11,176 | $944,085 | $755,272 | $188,813 |
| 2022 | $10,617 | $925,574 | $740,463 | $185,111 |
| 2021 | $10,632 | $907,427 | $725,945 | $181,482 |
| 2019 | $10,170 | $880,514 | $704,414 | $176,100 |
| 2018 | $10,054 | $863,250 | $690,602 | $172,648 |
| 2016 | $9,553 | $829,731 | $663,786 | $165,945 |
| 2015 | $9,538 | $817,269 | $653,816 | $163,453 |
| 2014 | $9,411 | $801,261 | $641,009 | $160,252 |
Source: Public Records
Map
Nearby Homes
- 26228 Birchfield Ave
- 26326 Birchfield Ave
- 5 Yellow Brick Rd
- 5508 Ironwood St
- 702 Via la Cuesta
- 4060 Via Opata
- 6039 Via Sonoma
- 6045 Montemalaga Dr
- 2521 Novato Place
- 3609 Palos Verdes Dr N
- 2708 Via Elevado
- 4548 Marloma Dr
- 1300 Granvia Altamira
- 2457 Via Sonoma
- 3321 Via la Selva
- 1133 Granvia Altamira
- 27032 Freeport Rd
- 121 Via Ardilla
- 3901 Via Cardelina
- 875 Calle de Arboles
- 5513 Bayridge Rd
- 5457 Bayridge Rd
- 5520 Graylog St
- 5512 Graylog St
- 5519 Bayridge Rd
- 5449 Bayridge Rd
- 5528 Graylog St
- 5506 Graylog St
- 5504 Bayridge Rd
- 5510 Bayridge Rd
- 5439 Bayridge Rd
- 5536 Graylog St
- 5525 Bayridge Rd
- 5456 Bayridge Rd
- 5516 Bayridge Rd
- 5439 Bayridge Rd
- 5522 Bayridge Rd
- 5448 Bayridge Rd
- 5542 Graylog St
- 5533 Bayridge Rd