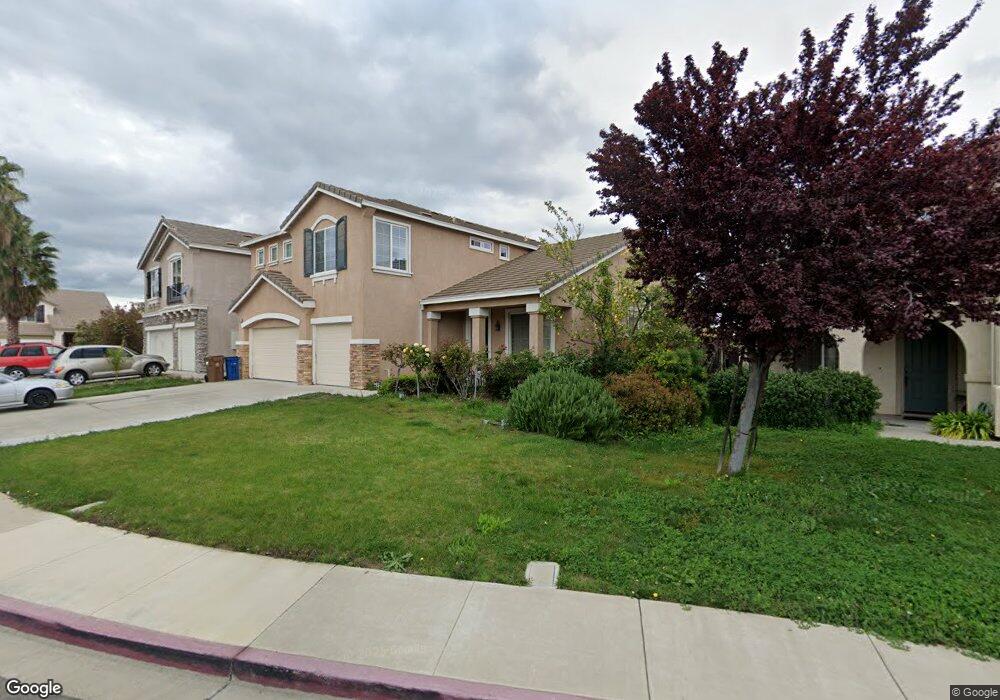
5507 Dovewood Ct Antioch, CA 94531
Lone Tree Valley NeighborhoodEstimated Value: $756,276 - $801,000
5
Beds
4
Baths
3,148
Sq Ft
$248/Sq Ft
Est. Value
About This Home
This home is located at 5507 Dovewood Ct, Antioch, CA 94531 and is currently estimated at $781,819, approximately $248 per square foot. 5507 Dovewood Ct is a home located in Contra Costa County with nearby schools including Diablo Vista Elementary School, Dallas Ranch Middle School, and Deer Valley High School.
Ownership History
Date
Name
Owned For
Owner Type
Purchase Details
Closed on
Apr 21, 2016
Sold by
Nguyen Tony S
Bought by
Nguyen Tony Sonthe
Current Estimated Value
Purchase Details
Closed on
Oct 27, 2011
Sold by
Pang Kenneth Hien and Pang Cindy Dee
Bought by
Nguyen Tony S
Home Financials for this Owner
Home Financials are based on the most recent Mortgage that was taken out on this home.
Original Mortgage
$202,500
Outstanding Balance
$138,085
Interest Rate
4.02%
Mortgage Type
New Conventional
Estimated Equity
$643,734
Purchase Details
Closed on
Aug 19, 2004
Sold by
West Coast Home Builders Inc
Bought by
Pang Kenneth Hien and Pang Cindy Dee
Home Financials for this Owner
Home Financials are based on the most recent Mortgage that was taken out on this home.
Original Mortgage
$452,420
Interest Rate
5.95%
Mortgage Type
Purchase Money Mortgage
Create a Home Valuation Report for This Property
The Home Valuation Report is an in-depth analysis detailing your home's value as well as a comparison with similar homes in the area
Home Values in the Area
Average Home Value in this Area
Purchase History
| Date | Buyer | Sale Price | Title Company |
|---|---|---|---|
| Nguyen Tony Sonthe | -- | None Available | |
| Nguyen Tony S | $270,000 | Old Republic Title Company | |
| Pang Kenneth Hien | $566,000 | Old Republic Title |
Source: Public Records
Mortgage History
| Date | Status | Borrower | Loan Amount |
|---|---|---|---|
| Open | Nguyen Tony S | $202,500 | |
| Previous Owner | Pang Kenneth Hien | $452,420 |
Source: Public Records
Tax History Compared to Growth
Tax History
| Year | Tax Paid | Tax Assessment Tax Assessment Total Assessment is a certain percentage of the fair market value that is determined by local assessors to be the total taxable value of land and additions on the property. | Land | Improvement |
|---|---|---|---|---|
| 2025 | $4,241 | $339,124 | $56,518 | $282,606 |
| 2024 | $4,058 | $332,475 | $55,410 | $277,065 |
| 2023 | $4,058 | $325,957 | $54,324 | $271,633 |
| 2022 | $3,999 | $319,566 | $53,259 | $266,307 |
| 2021 | $3,882 | $313,301 | $52,215 | $261,086 |
| 2019 | $3,791 | $304,010 | $50,667 | $253,343 |
| 2018 | $3,653 | $298,050 | $49,674 | $248,376 |
| 2017 | $3,578 | $292,206 | $48,700 | $243,506 |
| 2016 | $3,489 | $286,478 | $47,746 | $238,732 |
| 2015 | $3,763 | $282,176 | $47,029 | $235,147 |
| 2014 | $4,854 | $276,649 | $46,108 | $230,541 |
Source: Public Records
Map
Nearby Homes
- 5447 Benttree Way
- 5437 Prewett Ranch Dr
- 5213 Walker Ct
- 5611 Trinity Lakes Ln
- 5115 Equestrian Ct
- 5305 McDowell Valley Ln
- 5132 Pioneer Way
- 5004 Havenrock Ct
- 5165 Hereford Way
- 5371 Sopra St
- 5124 Longdale Ct
- 5131 Prewett Ranch Dr
- 5161 Maniago Way
- 5390 Shenandoah Valley Ln
- 5300 Vivaro Way
- 5052 Perry Way
- 5041 Wagon Wheel Way
- 5017 Perry Way
- 4848 Pineview Way
- 5124 Grass Valley Way
- 5505 Dovewood Ct
- 5509 Dovewood Ct
- 5511 Dovewood Ct
- 5517 Dovewood Ct
- 5519 Dovewood Ct
- 5428 San Martin Way
- 5515 Dovewood Ct
- 5415 Benttree Way
- 5411 Benttree Way
- 5500 Cedar Point Way
- 5407 Benttree Way
- 5419 Benttree Way
- 5504 Cedar Point Way
- 5432 San Martin Way
- 5513 Dovewood Ct
- 5508 Cedar Point Way
- 5403 Benttree Way
- 5424 San Martin Way
- 5521 Cedar Point Way
- 5512 Cedar Point Way