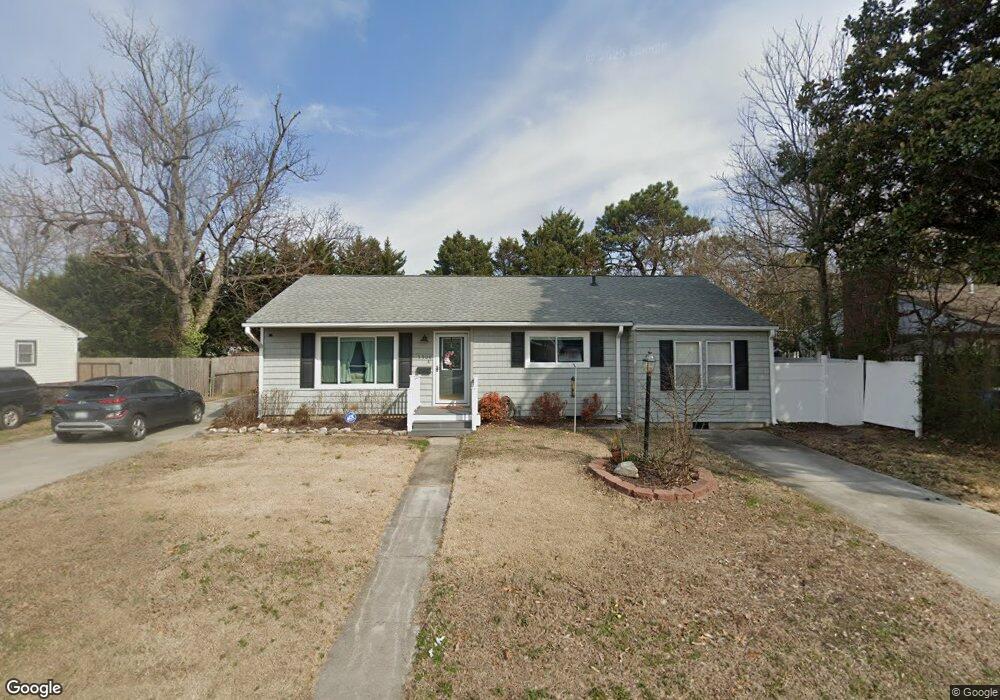
5508 Aurora Dr Virginia Beach, VA 23455
Bayside NeighborhoodEstimated Value: $391,000 - $426,000
4
Beds
2
Baths
1,800
Sq Ft
$225/Sq Ft
Est. Value
About This Home
This home is located at 5508 Aurora Dr, Virginia Beach, VA 23455 and is currently estimated at $405,377, approximately $225 per square foot. 5508 Aurora Dr is a home located in Virginia Beach City with nearby schools including Bayside Elementary School, Bayside 6th Grade Campus, and Bayside High School.
Ownership History
Date
Name
Owned For
Owner Type
Purchase Details
Closed on
Feb 23, 2024
Sold by
Mary Allen R and Mary Faye
Bought by
Morris Brandon and Bell Jasmyne
Current Estimated Value
Home Financials for this Owner
Home Financials are based on the most recent Mortgage that was taken out on this home.
Original Mortgage
$364,265
Outstanding Balance
$357,888
Interest Rate
6.66%
Mortgage Type
FHA
Estimated Equity
$47,489
Purchase Details
Closed on
Aug 31, 2016
Sold by
Stauffer Mary F and Stauffer Allen
Bought by
The Allen R And Mary Faye Revocable Livi
Purchase Details
Closed on
Jun 25, 2002
Sold by
Bridges Garrett
Bought by
Stauffer Mary F
Home Financials for this Owner
Home Financials are based on the most recent Mortgage that was taken out on this home.
Original Mortgage
$90,000
Interest Rate
6.92%
Mortgage Type
New Conventional
Create a Home Valuation Report for This Property
The Home Valuation Report is an in-depth analysis detailing your home's value as well as a comparison with similar homes in the area
Home Values in the Area
Average Home Value in this Area
Purchase History
| Date | Buyer | Sale Price | Title Company |
|---|---|---|---|
| Morris Brandon | $387,250 | Stewart Title | |
| The Allen R And Mary Faye Revocable Livi | -- | None Available | |
| Stauffer Mary F | $120,000 | -- |
Source: Public Records
Mortgage History
| Date | Status | Borrower | Loan Amount |
|---|---|---|---|
| Open | Morris Brandon | $364,265 | |
| Previous Owner | Stauffer Mary F | $90,000 |
Source: Public Records
Tax History Compared to Growth
Tax History
| Year | Tax Paid | Tax Assessment Tax Assessment Total Assessment is a certain percentage of the fair market value that is determined by local assessors to be the total taxable value of land and additions on the property. | Land | Improvement |
|---|---|---|---|---|
| 2025 | $2,666 | $373,100 | $150,000 | $223,100 |
| 2024 | $2,666 | $274,800 | $150,000 | $124,800 |
| 2023 | $2,339 | $236,300 | $104,000 | $132,300 |
| 2022 | $2,230 | $225,300 | $96,000 | $129,300 |
| 2021 | $2,098 | $211,900 | $93,000 | $118,900 |
| 2020 | $2,059 | $202,400 | $93,000 | $109,400 |
| 2019 | $788 | $191,000 | $89,300 | $101,700 |
| 2018 | $1,915 | $191,000 | $89,300 | $101,700 |
| 2017 | $383 | $191,000 | $89,300 | $101,700 |
| 2016 | $1,852 | $187,100 | $94,500 | $92,600 |
| 2015 | $1,841 | $186,000 | $94,500 | $91,500 |
| 2014 | $1,847 | $192,500 | $105,000 | $87,500 |
Source: Public Records
Map
Nearby Homes
- 5512 Forest View Dr
- 1549 Sagewood Dr
- 1536 Sagewood Dr
- 1900 Darnell Dr
- 1957 Darnell Dr
- 2110 Point Hollow Ct
- 2125 Point Hollow Ct
- 2134 Point Hollow Ct
- 5397 Shell Rd
- 5240 Lake Shores Rd
- 5113 S Lake Rd
- 5004 Savin Ct
- 1713 Keeling Rd
- 5248 Mile Course Walk
- 1729 Greenhouse Rd
- 1256 Foursome Ln
- 5028 Cullen Rd
- 1265 Foursome Ln
- 1226 Foursome Ln
- 1625 Lucia Ct
- 5512 Aurora Dr
- 5504 Aurora Dr
- 5521 Aragon Dr
- 5525 Aragon Dr
- 5516 Aurora Dr
- 5517 Aragon Dr
- 5513 Aurora Dr
- 5509 Aurora Dr
- 1805 Birchwood Rd
- 5500 Aurora Dr
- 5517 Aurora Dr
- 5529 Aragon Dr
- 5505 Aurora Dr
- 5513 Aragon Dr
- 5521 Aurora Dr
- 5520 Aurora Dr
- 1804 Janke Rd
- 1709 Birchwood Rd
- 5528 Odessa Dr
- 5524 Odessa Dr