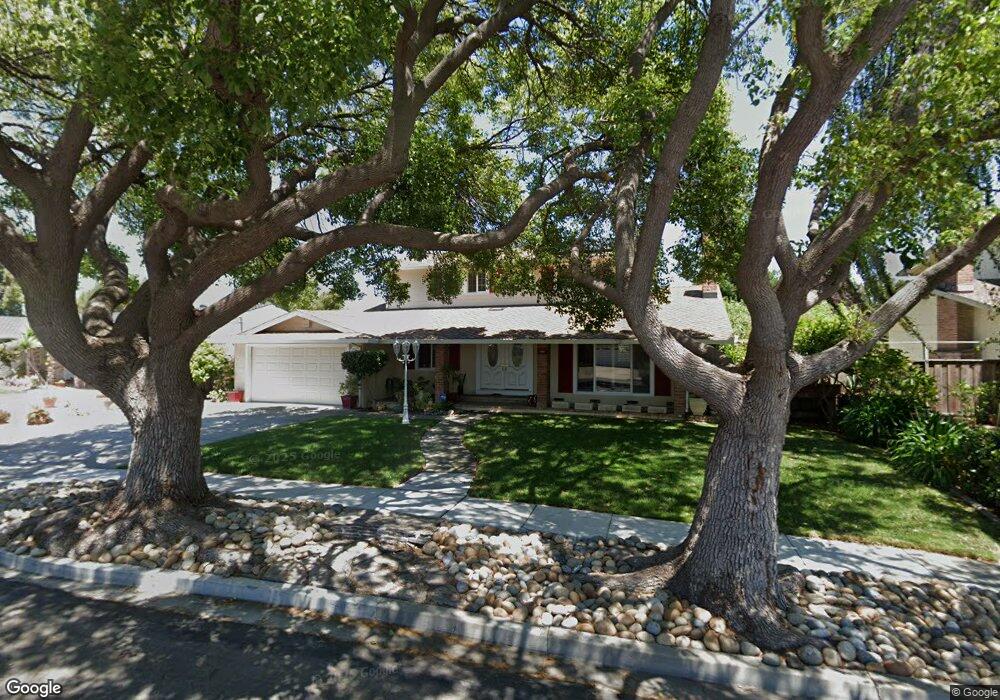
5508 Chapman Dr Newark, CA 94560
Estimated Value: $1,545,000 - $1,870,000
4
Beds
3
Baths
2,158
Sq Ft
$798/Sq Ft
Est. Value
About This Home
This home is located at 5508 Chapman Dr, Newark, CA 94560 and is currently estimated at $1,721,824, approximately $797 per square foot. 5508 Chapman Dr is a home located in Alameda County with nearby schools including John F. Kennedy Elementary School, Newark Junior High School, and Newark Memorial High School.
Ownership History
Date
Name
Owned For
Owner Type
Purchase Details
Closed on
Nov 29, 2018
Sold by
Li Xiaoyan
Bought by
Zou Yan
Current Estimated Value
Home Financials for this Owner
Home Financials are based on the most recent Mortgage that was taken out on this home.
Original Mortgage
$1,016,000
Outstanding Balance
$896,370
Interest Rate
4.87%
Mortgage Type
Adjustable Rate Mortgage/ARM
Estimated Equity
$825,454
Purchase Details
Closed on
Nov 27, 2018
Sold by
Cianciarulo Daniel and Weerawong Somtawin
Bought by
Zou Yan
Home Financials for this Owner
Home Financials are based on the most recent Mortgage that was taken out on this home.
Original Mortgage
$1,016,000
Outstanding Balance
$896,370
Interest Rate
4.87%
Mortgage Type
Adjustable Rate Mortgage/ARM
Estimated Equity
$825,454
Purchase Details
Closed on
Sep 12, 2011
Sold by
Teuscher Beverly J and The J & B Teuscher 1992 Revoca
Bought by
Cianciarulo Daniel and Weerawong Somtawin
Home Financials for this Owner
Home Financials are based on the most recent Mortgage that was taken out on this home.
Original Mortgage
$460,000
Interest Rate
4.37%
Mortgage Type
New Conventional
Create a Home Valuation Report for This Property
The Home Valuation Report is an in-depth analysis detailing your home's value as well as a comparison with similar homes in the area
Home Values in the Area
Average Home Value in this Area
Purchase History
| Date | Buyer | Sale Price | Title Company |
|---|---|---|---|
| Zou Yan | -- | Old Republic Title Company | |
| Zou Yan | $1,270,000 | Old Republic Title Company | |
| Cianciarulo Daniel | $575,000 | Old Republic Title Company |
Source: Public Records
Mortgage History
| Date | Status | Borrower | Loan Amount |
|---|---|---|---|
| Open | Zou Yan | $1,016,000 | |
| Previous Owner | Cianciarulo Daniel | $460,000 |
Source: Public Records
Tax History
| Year | Tax Paid | Tax Assessment Tax Assessment Total Assessment is a certain percentage of the fair market value that is determined by local assessors to be the total taxable value of land and additions on the property. | Land | Improvement |
|---|---|---|---|---|
| 2025 | $16,779 | $1,416,685 | $412,735 | $1,003,950 |
| 2024 | $16,779 | $1,388,910 | $404,643 | $984,267 |
| 2023 | $16,351 | $1,361,681 | $396,710 | $964,971 |
| 2022 | $16,180 | $1,334,985 | $388,932 | $946,053 |
| 2021 | $15,769 | $1,308,811 | $381,307 | $927,504 |
| 2020 | $15,659 | $1,295,400 | $377,400 | $918,000 |
| 2019 | $15,430 | $1,270,000 | $370,000 | $900,000 |
| 2018 | $7,936 | $634,736 | $190,421 | $444,315 |
| 2017 | $7,734 | $622,293 | $186,688 | $435,605 |
| 2016 | $7,656 | $610,091 | $183,027 | $427,064 |
| 2015 | $7,630 | $600,931 | $180,279 | $420,652 |
| 2014 | $7,423 | $589,161 | $176,748 | $412,413 |
Source: Public Records
Map
Nearby Homes
- 35415 Blackburn Dr
- 5136 Ramsgate Dr
- 35088 Lido Blvd Unit K
- 35926 Newark Blvd
- 35421 Cleremont Dr
- 6435 Normandy Dr
- 36188 Fig Tree Ln
- 36057 Dalewood Dr
- 5298 Sussex Place
- 35290 Farnham Dr
- 5245 Tacoma Common
- 5417 Ridgewood Dr
- 5585 Fernwood Dr
- 34590 Falls Terrace
- 5228 Falmouth Place
- 36276 Sandalwood St
- 34743 Chanel Terrace
- 5220 Fairbanks Common
- 34767 Shalimar Terrace
- 34827 Dorado Common
- 5476 Chapman Dr
- 5524 Chapman Dr
- 5458 Chapman Dr
- 5536 Chapman Dr
- 5509 Chapman Dr
- 5517 Chapman Dr
- 5483 Chapman Dr
- 5535 Chapman Dr
- 5467 Chapman Dr
- 5442 Chapman Dr
- 5554 Chapman Dr
- 5551 Chapman Dr
- 5628 Abington Dr
- 5662 Abington Dr
- 5582 Abington Dr
- 5449 Chapman Dr
- 5674 Abington Dr
- 5574 Abington Dr
- 5590 Chapman Dr
- 5569 Chapman Dr
Your Personal Tour Guide
Ask me questions while you tour the home.