5508 E Aspen Ave Castle Rock, CO 80104
Founders Village NeighborhoodEstimated Value: $582,000 - $656,000
4
Beds
3
Baths
2,719
Sq Ft
$226/Sq Ft
Est. Value
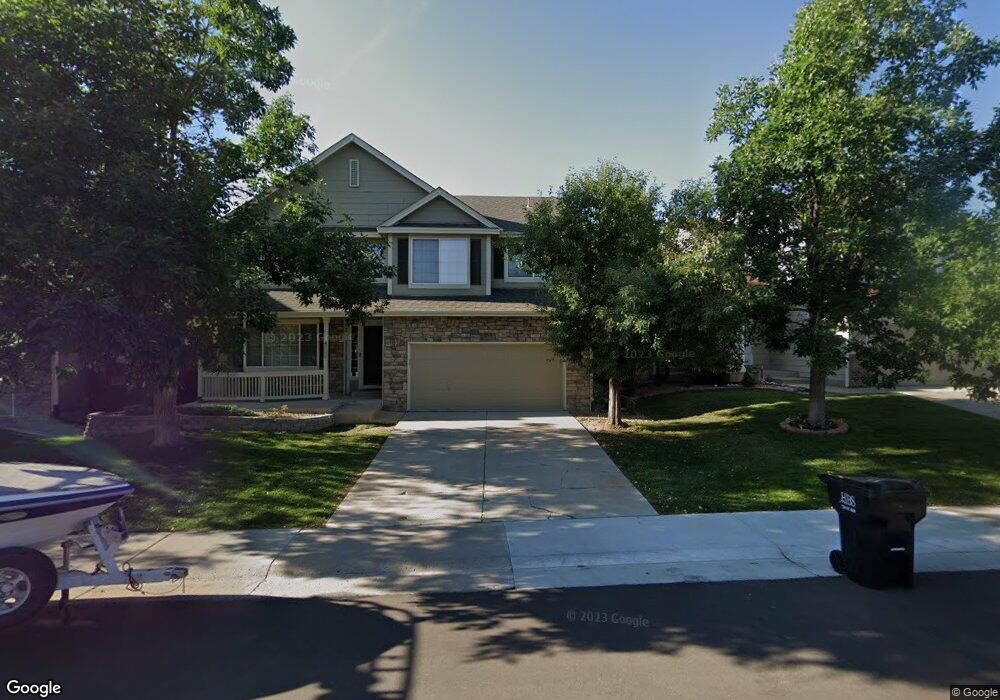
About This Home
This home is located at 5508 E Aspen Ave, Castle Rock, CO 80104 and is currently estimated at $614,275, approximately $225 per square foot. 5508 E Aspen Ave is a home located in Douglas County with nearby schools including Rock Ridge Elementary School, Mesa Middle School, and Douglas County High School.
Ownership History
Date
Name
Owned For
Owner Type
Purchase Details
Closed on
Oct 15, 2021
Sold by
Petit Tammy L
Bought by
Petit Tammy L and Loveland Lloyd C
Current Estimated Value
Home Financials for this Owner
Home Financials are based on the most recent Mortgage that was taken out on this home.
Original Mortgage
$312,000
Outstanding Balance
$284,515
Interest Rate
2.8%
Mortgage Type
New Conventional
Estimated Equity
$329,760
Purchase Details
Closed on
Jun 24, 1999
Sold by
Engle Homes Colorado Inc
Bought by
Petit Reinaldo E and Petit Tammy L
Home Financials for this Owner
Home Financials are based on the most recent Mortgage that was taken out on this home.
Original Mortgage
$199,750
Interest Rate
7.21%
Mortgage Type
FHA
Purchase Details
Closed on
Aug 7, 1998
Sold by
Sunborne Ten
Bought by
Engle Homes Colo Inc
Purchase Details
Closed on
Mar 31, 1998
Sold by
Ash Kenneth E
Bought by
Sunborne Ten Co
Purchase Details
Closed on
Aug 1, 1994
Sold by
Sandburst Inc
Bought by
Ash Kenneth E
Create a Home Valuation Report for This Property
The Home Valuation Report is an in-depth analysis detailing your home's value as well as a comparison with similar homes in the area
Home Values in the Area
Average Home Value in this Area
Purchase History
| Date | Buyer | Sale Price | Title Company |
|---|---|---|---|
| Petit Tammy L | -- | Pta | |
| Petit Reinaldo E | $201,100 | Universal Land Title | |
| Engle Homes Colo Inc | $640,200 | -- | |
| Sunborne Ten Co | $82,700 | -- | |
| Ash Kenneth E | $366,000 | -- |
Source: Public Records
Mortgage History
| Date | Status | Borrower | Loan Amount |
|---|---|---|---|
| Open | Petit Tammy L | $312,000 | |
| Closed | Petit Reinaldo E | $199,750 |
Source: Public Records
Tax History Compared to Growth
Tax History
| Year | Tax Paid | Tax Assessment Tax Assessment Total Assessment is a certain percentage of the fair market value that is determined by local assessors to be the total taxable value of land and additions on the property. | Land | Improvement |
|---|---|---|---|---|
| 2024 | $6,504 | $43,280 | $8,430 | $34,850 |
| 2023 | $6,542 | $43,280 | $8,430 | $34,850 |
| 2022 | $4,791 | $30,260 | $6,240 | $24,020 |
| 2021 | $4,880 | $30,260 | $6,240 | $24,020 |
| 2020 | $4,647 | $29,660 | $5,890 | $23,770 |
| 2019 | $4,649 | $29,660 | $5,890 | $23,770 |
| 2018 | $4,195 | $26,560 | $4,560 | $22,000 |
| 2017 | $4,038 | $26,560 | $4,560 | $22,000 |
| 2016 | $3,433 | $23,580 | $4,450 | $19,130 |
| 2015 | $3,478 | $23,580 | $4,450 | $19,130 |
| 2014 | $3,006 | $19,570 | $3,940 | $15,630 |
Source: Public Records
Map
Nearby Homes
- 109 N Quicksilver Ave
- 157 S Quicksilver Ave
- 330 N Wagonwheel Trail
- 5323 E Sandpiper Ave
- 5521 Spruce Ave
- 364 N Willow St
- 5326 E Howe St
- 5617 E Prescott Ave
- 5864 Turnstone Place
- 5282 Devon Ave
- 5931 Wescroft Ave
- 613 N Brentwood Ct
- 5181 Devon Ave
- 176 S Pembrook St
- 535 Howe St
- 5939 Still Meadow Place
- 328 Vista Cliff Cir
- 107 S Edge Cliff St
- 5938 Still Meadow Place
- 650 Howe Cir
- 5520 E Aspen Ave
- 5484 E Aspen Ave
- 5544 E Aspen Ave
- 5462 E Aspen Ave
- 5503 E Aspen Ave
- 5539 E Aspen Ave
- 5448 E Aspen Ave
- 5560 E Aspen Ave
- 5589 E Aspen Ave
- 105 Laramie Ct
- 5521 Lost Meadow Trail
- 5507 Lost Meadow Trail
- 5463 E Aspen Ave
- 5424 E Aspen Ave
- 28 Ponderosa St
- 5580 E Aspen Ave
- 5632 Spruce Ave
- 84 Laramie Ct
- 119 Laramie Ct
- 5447 E Aspen Ave