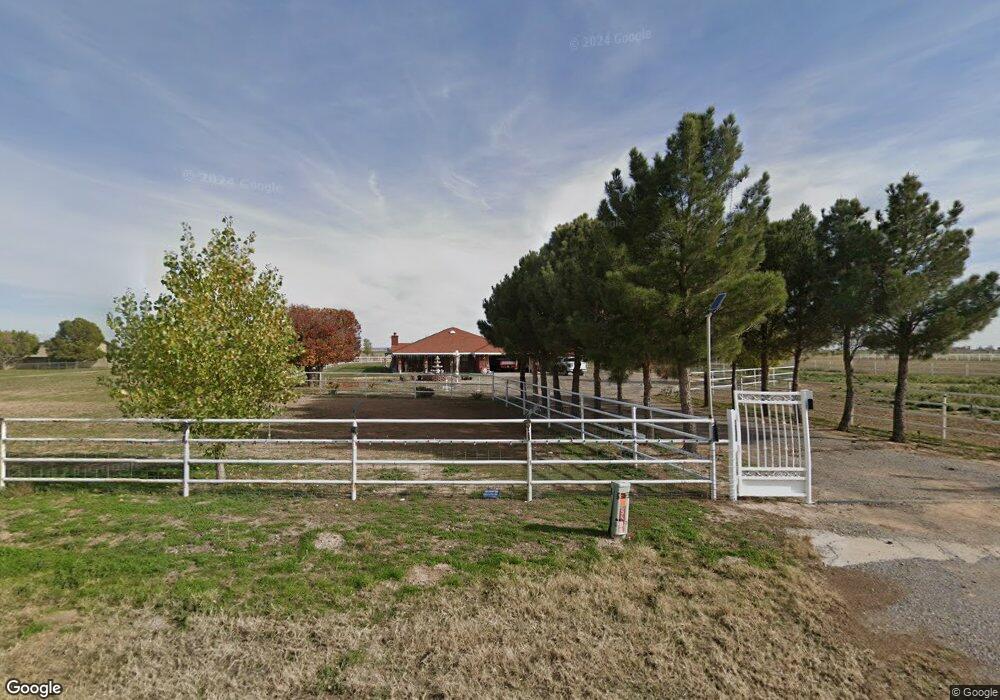
5509 Chisum Rd Roswell, NM 88203
Estimated Value: $298,000
3
Beds
2
Baths
3,508
Sq Ft
$85/Sq Ft
Est. Value
About This Home
This home is located at 5509 Chisum Rd, Roswell, NM 88203 and is currently estimated at $298,000, approximately $84 per square foot. 5509 Chisum Rd is a home located in Chaves County with nearby schools including East Grand Plains Elementary School, Mountain View Middle School, and Early College High School.
Ownership History
Date
Name
Owned For
Owner Type
Purchase Details
Closed on
Oct 23, 2023
Sold by
Caro Leonel and Caro Graciela
Bought by
Caro Leonel and Caro Graciela
Current Estimated Value
Purchase Details
Closed on
Sep 12, 2021
Sold by
Gutierrez Jacquelynn and Caro Jacquelynn
Bought by
Caro Leonel and Caro Graciela
Purchase Details
Closed on
Dec 31, 2015
Sold by
Villalobos Leonel Caro and Caro Graciela
Bought by
Caro Jacquelynn
Home Financials for this Owner
Home Financials are based on the most recent Mortgage that was taken out on this home.
Original Mortgage
$275,742
Interest Rate
4.4%
Mortgage Type
FHA
Purchase Details
Closed on
Nov 14, 2005
Sold by
Chaidoz Felipe
Bought by
Villalobos Leonel Caro and Caro Graciela
Home Financials for this Owner
Home Financials are based on the most recent Mortgage that was taken out on this home.
Original Mortgage
$243,900
Interest Rate
5.9%
Mortgage Type
New Conventional
Create a Home Valuation Report for This Property
The Home Valuation Report is an in-depth analysis detailing your home's value as well as a comparison with similar homes in the area
Home Values in the Area
Average Home Value in this Area
Purchase History
| Date | Buyer | Sale Price | Title Company |
|---|---|---|---|
| Caro Leonel | -- | None Listed On Document | |
| Caro Leonel | -- | None Available | |
| Caro Leonel | -- | None Available | |
| Caro Jacquelynn | -- | Fidelity National Title | |
| Villalobos Leonel Caro | -- | None Available |
Source: Public Records
Mortgage History
| Date | Status | Borrower | Loan Amount |
|---|---|---|---|
| Previous Owner | Caro Jacquelynn | $275,742 | |
| Previous Owner | Villalobos Leonel Caro | $243,900 |
Source: Public Records
Tax History Compared to Growth
Tax History
| Year | Tax Paid | Tax Assessment Tax Assessment Total Assessment is a certain percentage of the fair market value that is determined by local assessors to be the total taxable value of land and additions on the property. | Land | Improvement |
|---|---|---|---|---|
| 2025 | $2,549 | $7,934 | $0 | $7,934 |
| 2024 | $2,549 | $107,974 | $7,040 | $100,934 |
| 2023 | $2,515 | $111,741 | $7,040 | $104,701 |
| 2022 | $2,445 | $109,123 | $7,040 | $102,083 |
| 2021 | $2,213 | $99,201 | $7,040 | $92,161 |
| 2020 | $2,157 | $96,613 | $7,040 | $89,573 |
| 2019 | $2,167 | $97,126 | $7,040 | $90,086 |
| 2018 | $2,108 | $94,661 | $7,040 | $87,621 |
| 2017 | $2,005 | $91,748 | $7,040 | $84,708 |
| 2016 | $1,997 | $92,297 | $5,808 | $86,489 |
| 2015 | $2,096 | $88,331 | $5,808 | $82,523 |
| 2014 | $4,089 | $86,198 | $5,808 | $80,390 |
Source: Public Records
Map
Nearby Homes
- 5605 Old Dexter Hwy
- 301 Tumbleweed Rd
- 29 E Phoenix Rd
- 3950 Cottonwood Ln
- 3982 S Springs Loop
- 1907 White Mill Rd
- 3943 S Springs Loop
- 22 I St
- 12 Partial Rd
- 12 Murphy Place
- 00 Hamill Rd St
- 89 Lighthall Place
- 000 SE Main St
- 00 SE Main St
- 6649 Russell Rd
- 1207 E Holland Dr
- 5000 S Main St
- 1101 E Beech St
- 3801 S Main St
- 6662 Dakota Rd
- 5473 Chisum Rd
- 5500 Chisum Rd
- 9 Birdsall Place
- 5601 Chisum Rd
- 5425 Chisum Ave
- 5425 Chisum Rd
- 5424 Chisum Rd
- 5602 Chisum Rd
- 5510 Chisum Rd
- 7 Birdsall Place
- 5801 Chisum Rd
- 8 Birdsall Place
- 1 Farris Place
- 5321 Chisum Rd
- 3716 East Grand Plains Rd
- 5318 Chisum Rd
- 5809 Chisum Rd
- 3727 Whitehead Rd
- 3736 East Grand Plains Rd
- 5200 Chisum Rd