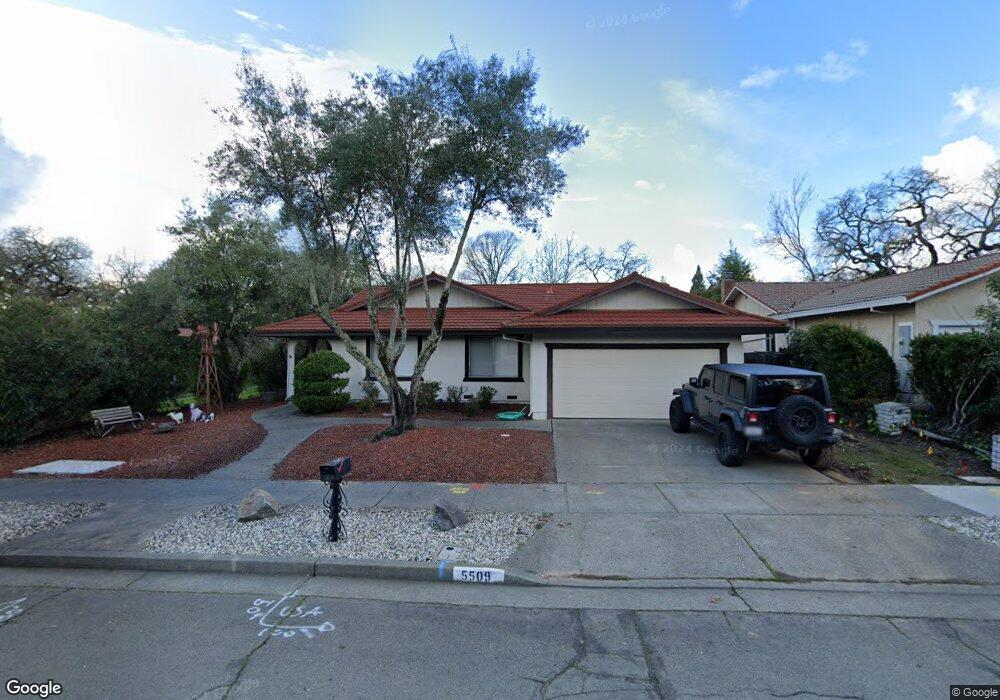
5509 El Encanto Dr Santa Rosa, CA 95409
Skyhawk NeighborhoodEstimated Value: $739,267 - $881,000
3
Beds
2
Baths
1,822
Sq Ft
$441/Sq Ft
Est. Value
About This Home
This home is located at 5509 El Encanto Dr, Santa Rosa, CA 95409 and is currently estimated at $803,567, approximately $441 per square foot. 5509 El Encanto Dr is a home located in Sonoma County with nearby schools including Sequoia Elementary School, Rincon Valley Middle School, and Maria Carrillo High School.
Ownership History
Date
Name
Owned For
Owner Type
Purchase Details
Closed on
Dec 27, 2023
Sold by
Christopher E Crocker E and Christopher Sharon A
Bought by
Christopher E Crocker And Sharon A Crocker Tr and Crocker
Current Estimated Value
Purchase Details
Closed on
Oct 17, 2017
Sold by
Crocker Sharon A E and Crocker Christopher E
Bought by
Crocker Sharon A E and Crocker Christopher E
Purchase Details
Closed on
May 19, 2011
Sold by
Crocker Sharon Athene
Bought by
Crocker Christopher E and Crocker Sharon A
Purchase Details
Closed on
Mar 30, 2011
Sold by
Crocker Sharon Athene and The Mac F Graves & Ann Graves
Bought by
Croker Sharon Athene
Purchase Details
Closed on
Dec 13, 1995
Sold by
Crocker Lisa Lynn and Crocker Clifford P
Bought by
Crocker Clifford P and Graves Mac F
Create a Home Valuation Report for This Property
The Home Valuation Report is an in-depth analysis detailing your home's value as well as a comparison with similar homes in the area
Home Values in the Area
Average Home Value in this Area
Purchase History
| Date | Buyer | Sale Price | Title Company |
|---|---|---|---|
| Christopher E Crocker And Sharon A Crocker Tr | -- | None Listed On Document | |
| Crocker Sharon A E | -- | None Available | |
| Crocker Christopher E | -- | None Available | |
| Croker Sharon Athene | -- | None Available | |
| Crocker Clifford P | $67,500 | Sonoma Title Guaranty Compan |
Source: Public Records
Tax History Compared to Growth
Tax History
| Year | Tax Paid | Tax Assessment Tax Assessment Total Assessment is a certain percentage of the fair market value that is determined by local assessors to be the total taxable value of land and additions on the property. | Land | Improvement |
|---|---|---|---|---|
| 2025 | $1,782 | $142,540 | $28,262 | $114,278 |
| 2024 | $1,782 | $139,746 | $27,708 | $112,038 |
| 2023 | $1,782 | $137,007 | $27,165 | $109,842 |
| 2022 | $1,649 | $134,322 | $26,633 | $107,689 |
| 2021 | $1,616 | $131,689 | $26,111 | $105,578 |
| 2020 | $1,610 | $130,340 | $25,844 | $104,496 |
| 2019 | $1,594 | $127,786 | $25,338 | $102,448 |
| 2018 | $1,582 | $125,282 | $24,842 | $100,440 |
| 2017 | $1,553 | $122,826 | $24,355 | $98,471 |
| 2016 | $1,526 | $120,419 | $23,878 | $96,541 |
| 2015 | $1,481 | $118,611 | $23,520 | $95,091 |
| 2014 | $1,428 | $116,289 | $23,060 | $93,229 |
Source: Public Records
Map
Nearby Homes
- 5518 Marit Dr
- 184 El Encanto Way
- 5534 Rainbow Cir
- 5682 Raters Dr
- 5056 Fravel Ln
- 5741 Evening Way
- 5388 Sonoma Hwy
- 5088 Firestone Ct
- 305 Simone Place N
- 5794 Owl Hill Ave
- 5086 Charmian Dr
- 5644 Eastlake Dr
- 537 Emerald Park Ct
- 5209 San Luis Ave
- 5426 Spring Lake Ct
- 206 Indian Creek Dr
- 5015 Charmian Dr
- 311 Algiers Ct
- 5020 Roma St
- 66 Coronado Cir
- 5513 El Encanto Dr
- 5510 El Encanto Dr
- 5517 El Encanto Dr
- 5510 El Encanto Way
- 5508 Marit Dr
- 5512 Marit Dr
- 5521 El Encanto Dr
- 209 El Encanto Way
- 5547 El Encanto Cir
- 5505 El Encanto Cir
- 5500 Marit Dr
- 5516 Marit Dr
- 5511 El Encanto Cir
- 5527 El Encanto Dr
- 5543 El Encanto Cir
- 205 El Encanto Way
- 5412 Marit Dr
- 5507 Marit Dr
- 5501 Marit Dr
- 5515 El Encanto Cir