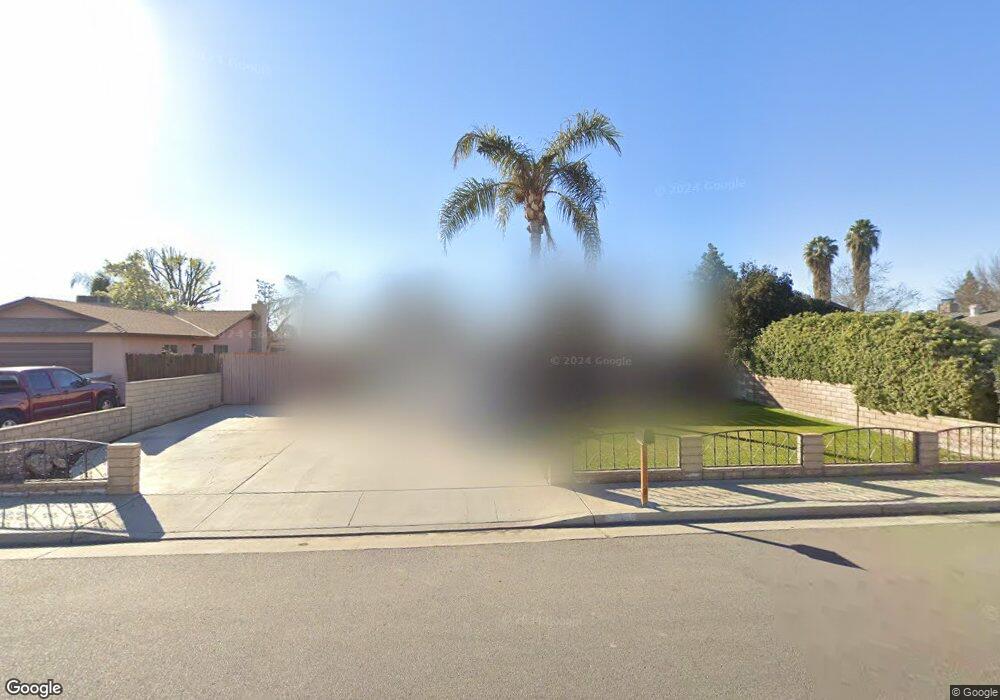
5509 Sara Jane St Bakersfield, CA 93313
Venola NeighborhoodEstimated Value: $294,000 - $393,000
3
Beds
2
Baths
1,343
Sq Ft
$264/Sq Ft
Est. Value
About This Home
This home is located at 5509 Sara Jane St, Bakersfield, CA 93313 and is currently estimated at $353,897, approximately $263 per square foot. 5509 Sara Jane St is a home located in Kern County with nearby schools including Roy W. Loudon Elementary School, Fred L. Thompson Junior High School, and Ridgeview High School.
Ownership History
Date
Name
Owned For
Owner Type
Purchase Details
Closed on
Oct 25, 2023
Sold by
Pimentel Juan
Bought by
Pimentel Juan Luis and Pimentel Erendira
Current Estimated Value
Purchase Details
Closed on
Jun 25, 2012
Sold by
Reyes Erendira
Bought by
Pimentel Juan
Home Financials for this Owner
Home Financials are based on the most recent Mortgage that was taken out on this home.
Original Mortgage
$142,373
Interest Rate
3.62%
Mortgage Type
FHA
Purchase Details
Closed on
Jun 18, 2012
Sold by
Navarro Jose M and Navarro Elena
Bought by
Pimentel Juan
Home Financials for this Owner
Home Financials are based on the most recent Mortgage that was taken out on this home.
Original Mortgage
$142,373
Interest Rate
3.62%
Mortgage Type
FHA
Purchase Details
Closed on
Apr 9, 2002
Sold by
Parker Dero D and Parker Bonnie Sue
Bought by
Navarro Jose M and Navarro Elena
Home Financials for this Owner
Home Financials are based on the most recent Mortgage that was taken out on this home.
Original Mortgage
$121,500
Interest Rate
7.18%
Purchase Details
Closed on
Feb 11, 1998
Sold by
Parker Dero D and Parker Bonnie
Bought by
Parker Dero D and Parker Bonnie Sue
Create a Home Valuation Report for This Property
The Home Valuation Report is an in-depth analysis detailing your home's value as well as a comparison with similar homes in the area
Home Values in the Area
Average Home Value in this Area
Purchase History
| Date | Buyer | Sale Price | Title Company |
|---|---|---|---|
| Pimentel Juan Luis | -- | None Listed On Document | |
| Pimentel Juan | -- | Placer Title Company | |
| Pimentel Juan | $145,000 | Placer Title Company | |
| Navarro Jose M | $146,000 | Commonwealth Land Title Co | |
| Parker Dero D | -- | -- |
Source: Public Records
Mortgage History
| Date | Status | Borrower | Loan Amount |
|---|---|---|---|
| Previous Owner | Pimentel Juan | $142,373 | |
| Previous Owner | Navarro Jose M | $121,500 |
Source: Public Records
Tax History Compared to Growth
Tax History
| Year | Tax Paid | Tax Assessment Tax Assessment Total Assessment is a certain percentage of the fair market value that is determined by local assessors to be the total taxable value of land and additions on the property. | Land | Improvement |
|---|---|---|---|---|
| 2025 | $2,747 | $178,542 | $43,093 | $135,449 |
| 2024 | $2,701 | $175,043 | $42,249 | $132,794 |
| 2023 | $2,701 | $171,612 | $41,421 | $130,191 |
| 2022 | $2,590 | $168,248 | $40,609 | $127,639 |
| 2021 | $2,477 | $164,950 | $39,813 | $125,137 |
| 2020 | $2,428 | $163,259 | $39,405 | $123,854 |
| 2019 | $2,395 | $163,259 | $39,405 | $123,854 |
| 2018 | $2,292 | $156,922 | $37,876 | $119,046 |
| 2017 | $2,257 | $153,846 | $37,134 | $116,712 |
| 2016 | $2,118 | $150,830 | $36,406 | $114,424 |
| 2015 | $2,098 | $148,566 | $35,860 | $112,706 |
| 2014 | $2,045 | $145,657 | $35,158 | $110,499 |
Source: Public Records
Map
Nearby Homes
- 3504 Charlotte St
- 5901 Castleford St
- 5913 El Camino Ave
- 6013 Lugene Ave
- 4116 Margalo Ave
- 6210 Marconi Ave
- 6223 Marconi Ave
- 6205 Marconi Ave
- 6204 Marconi Ave
- 6211 Marconi Ave
- 4101 Thatch Ave
- 4909 Kathimae Ln
- 6201 Wible Rd Unit 25
- 6201 Wible Rd Unit 58
- 6201 Wible Rd Unit 57
- 6201 Wible Rd Unit 42
- 4301 Sugar Cane Ave
- 0 Ringsdale Ct
- 4313 Thatch Ave
- 5907 Stacey St
- 5505 Sara Jane St
- 5513 Sara Jane St
- 5517 Sara Jane St
- 5501 Sara Jane St
- 5521 Sara Jane St
- 5508 Krista St
- 5504 Krista St
- 5512 Krista St
- 3416 Margalo Ct
- 5516 Krista St
- 5500 Krista St
- 5601 Sara Jane St
- 5407 Sara Jane St
- 3412 Margalo Ct
- 5520 Krista St
- 3417 Margalo Ct
- 5605 Sara Jane St
- 5408 Krista St
- 5600 Krista St
- 5405 Sara Jane St