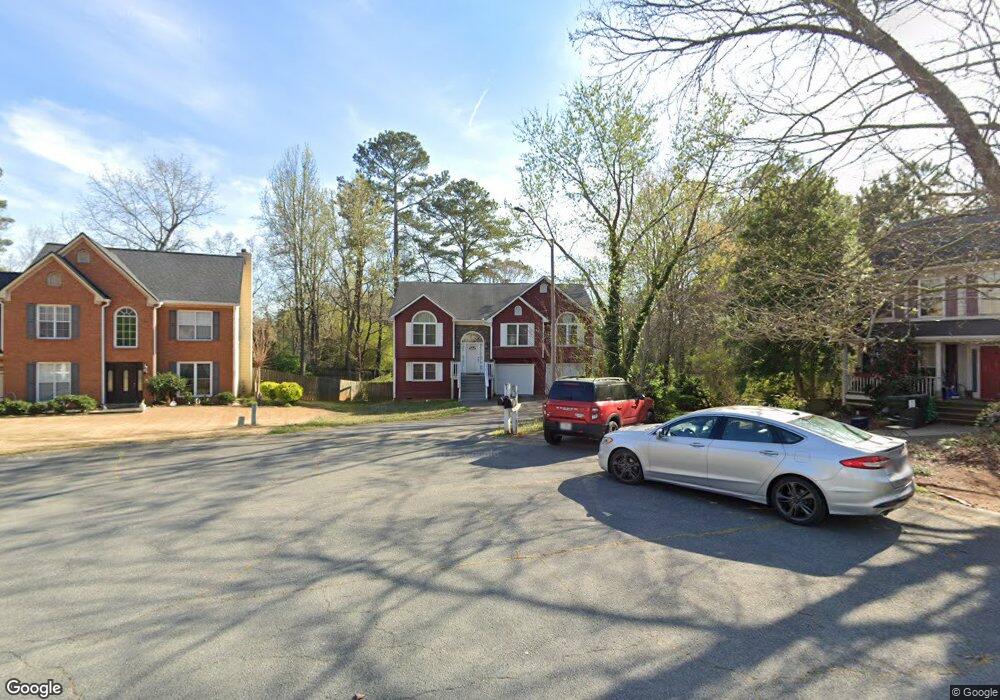
551 Antebellum Dr SW Marietta, GA 30060
Southwestern Marietta NeighborhoodEstimated Value: $268,000 - $402,000
4
Beds
3
Baths
1,583
Sq Ft
$213/Sq Ft
Est. Value
About This Home
This home is located at 551 Antebellum Dr SW, Marietta, GA 30060 and is currently estimated at $336,421, approximately $212 per square foot. 551 Antebellum Dr SW is a home located in Cobb County with nearby schools including Birney Elementary School, Floyd Middle School, and Osborne High School.
Ownership History
Date
Name
Owned For
Owner Type
Purchase Details
Closed on
Dec 14, 2011
Sold by
Federal Home Loan Mortgage Corporation
Bought by
Kingston Reba
Current Estimated Value
Purchase Details
Closed on
Aug 2, 2011
Sold by
Bank Of America Na
Bought by
Federal Home Loan Mortgage Corporation
Purchase Details
Closed on
Aug 28, 2001
Sold by
Bonilla William E
Bought by
Bonilla William E and Bonilla Carlos
Home Financials for this Owner
Home Financials are based on the most recent Mortgage that was taken out on this home.
Original Mortgage
$154,700
Interest Rate
6.97%
Mortgage Type
New Conventional
Purchase Details
Closed on
Mar 21, 1994
Sold by
Edgewater Homes Inc
Bought by
Cagle Raymond K Lynn
Home Financials for this Owner
Home Financials are based on the most recent Mortgage that was taken out on this home.
Original Mortgage
$109,250
Interest Rate
7.1%
Create a Home Valuation Report for This Property
The Home Valuation Report is an in-depth analysis detailing your home's value as well as a comparison with similar homes in the area
Home Values in the Area
Average Home Value in this Area
Purchase History
| Date | Buyer | Sale Price | Title Company |
|---|---|---|---|
| Kingston Reba | $78,500 | -- | |
| Federal Home Loan Mortgage Corporation | $104,297 | -- | |
| Bank Of America Na | $104,297 | -- | |
| Bonilla William E | -- | -- | |
| Bonilla William E | $162,900 | -- | |
| Cagle Raymond K Lynn | $115,000 | -- |
Source: Public Records
Mortgage History
| Date | Status | Borrower | Loan Amount |
|---|---|---|---|
| Previous Owner | Bonilla William E | $154,700 | |
| Previous Owner | Cagle Raymond K Lynn | $109,250 |
Source: Public Records
Tax History Compared to Growth
Tax History
| Year | Tax Paid | Tax Assessment Tax Assessment Total Assessment is a certain percentage of the fair market value that is determined by local assessors to be the total taxable value of land and additions on the property. | Land | Improvement |
|---|---|---|---|---|
| 2025 | $581 | $134,828 | $30,000 | $104,828 |
| 2024 | $461 | $93,844 | $14,000 | $79,844 |
| 2023 | $255 | $93,844 | $14,000 | $79,844 |
| 2022 | $461 | $93,844 | $14,000 | $79,844 |
| 2021 | $391 | $70,296 | $12,800 | $57,496 |
| 2020 | $391 | $70,296 | $12,800 | $57,496 |
| 2019 | $391 | $70,296 | $12,800 | $57,496 |
| 2018 | $329 | $49,552 | $10,000 | $39,552 |
| 2017 | $298 | $49,552 | $10,000 | $39,552 |
| 2016 | $300 | $49,552 | $10,000 | $39,552 |
| 2015 | $323 | $49,552 | $10,000 | $39,552 |
| 2014 | $266 | $31,372 | $0 | $0 |
Source: Public Records
Map
Nearby Homes
- 3241 Wildwood Dr SW
- 3308 Wildwood Dr SW
- 430 Church Rd SW
- 2969 Favor Rd SW Unit 1
- 3421 Mill Stream Ln SW Unit 3
- 3427 Mill Stream Ln SW
- 3065 Moser Way
- 3090 Moser Way
- 800 Grindstone Place SW
- 444 White Oak Dr SW
- 3337 Mill Stream Ln SW
- 825 Winfield Ct SW
- 760 Stone Harbor Pkwy SW
- 537 Shay Dr SW Unit 9
- 3355 Carolina Wren Trail SW
- 3306 Harrow Ct SW
- 959 Old Milford Church Rd SW
- 2940 Caller Ct SW
- 561 Antebellum Dr SW
- 541 Antebellum Dr SW
- 3087 Favor Pines Ct SW
- 560 Antebellum Dr SW
- 531 Antebellum Dr SW
- 3170 Wildwood Dr SW
- 3077 Favor Pines Ct SW
- 3180 Wildwood Dr SW
- 521 Antebellum Dr SW
- 540 Antebellum Dr SW
- 550 Antebellum Dr SW
- 3098 Favor Pines Ct SW
- 3067 Favor Pines Ct SW
- 530 Antebellum Dr SW
- 520 Antebellum Dr SW
- 511 Antebellum Dr SW
- 3190 Wildwood Dr SW
- 3088 Favor Pines Ct SW
- 510 Antebellum Dr SW
- 3078 Favor Pines Ct SW