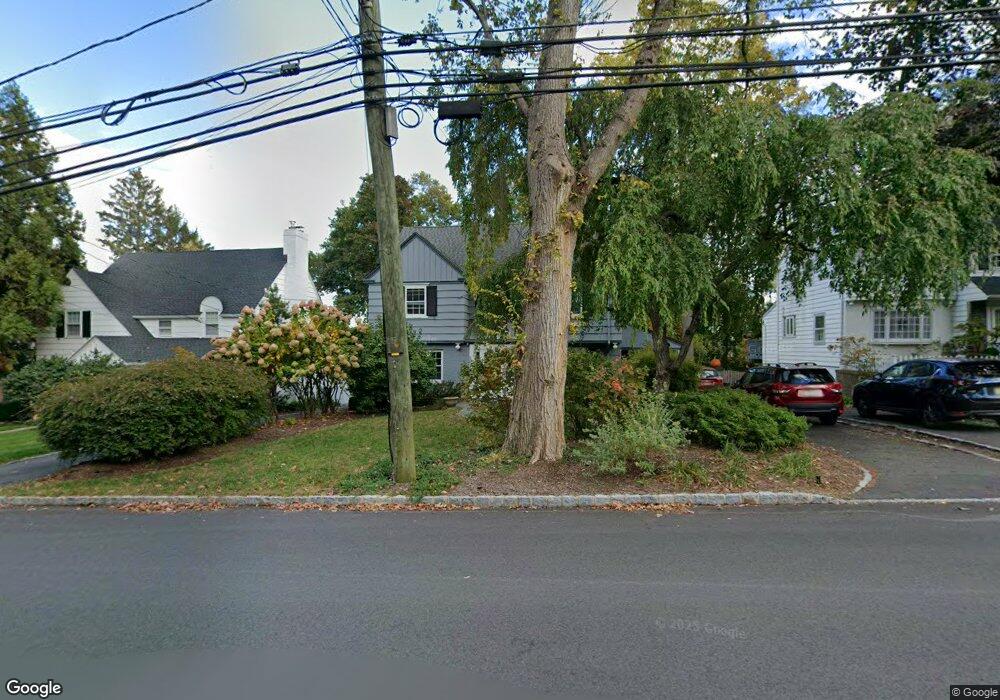
551 Park St Montclair, NJ 07043
Estimated Value: $1,324,000 - $1,600,000
Studio
--
Bath
2,627
Sq Ft
$575/Sq Ft
Est. Value
About This Home
This home is located at 551 Park St, Montclair, NJ 07043 and is currently estimated at $1,511,306, approximately $575 per square foot. 551 Park St is a home located in Essex County with nearby schools including Bradford School, Hillside School, and Nishuane School.
Ownership History
Date
Name
Owned For
Owner Type
Purchase Details
Closed on
Jun 9, 2020
Sold by
Kerbel Howard M and Fuqua Elizabeth J
Bought by
Kerbel Howard M and Fuqua Elizabeth J
Current Estimated Value
Purchase Details
Closed on
Feb 24, 2000
Purchase Details
Closed on
Sep 13, 1994
Sold by
Record Scott
Bought by
Kerbel Howard and Kerbel Elizabeth
Home Financials for this Owner
Home Financials are based on the most recent Mortgage that was taken out on this home.
Original Mortgage
$374,000
Interest Rate
8.56%
Create a Home Valuation Report for This Property
The Home Valuation Report is an in-depth analysis detailing your home's value as well as a comparison with similar homes in the area
Home Values in the Area
Average Home Value in this Area
Purchase History
| Date | Buyer | Sale Price | Title Company |
|---|---|---|---|
| Kerbel Howard M | -- | None Available | |
| -- | -- | -- | |
| Kerbel Howard | $415,000 | -- |
Source: Public Records
Mortgage History
| Date | Status | Borrower | Loan Amount |
|---|---|---|---|
| Previous Owner | Kerbel Howard | $374,000 |
Source: Public Records
Tax History
| Year | Tax Paid | Tax Assessment Tax Assessment Total Assessment is a certain percentage of the fair market value that is determined by local assessors to be the total taxable value of land and additions on the property. | Land | Improvement |
|---|---|---|---|---|
| 2025 | $29,456 | $865,600 | $370,100 | $495,500 |
| 2024 | $29,257 | $865,600 | $370,100 | $495,500 |
| 2022 | $27,968 | $865,600 | $370,100 | $495,500 |
| 2021 | $27,232 | $865,600 | $370,100 | $495,500 |
| 2020 | $27,517 | $865,600 | $370,100 | $495,500 |
| 2019 | $27,232 | $865,600 | $370,100 | $495,500 |
| 2018 | $26,782 | $865,600 | $370,100 | $495,500 |
| 2017 | $26,601 | $712,400 | $336,100 | $376,300 |
| 2016 | $25,889 | $712,400 | $336,100 | $376,300 |
| 2015 | $25,119 | $712,400 | $336,100 | $376,300 |
| 2014 | $24,279 | $712,400 | $336,100 | $376,300 |
Source: Public Records
Map
Nearby Homes
- 138 Alexander Ave
- 8 MacOpin Ave
- 11 Kenneth Rd
- 31 Nassau Rd
- 117 Yantacaw Brook Rd
- 30 Wellesley Rd
- 8350 Blvd E Unit 3A
- 14 Marion Rd
- 15 Garfield Place
- 112 Heller Way
- 33 Tuers Place
- 524 Upper Mountain Ave
- 11 Valley Place
- 1283 Valley Rd Unit 7
- 34 Carline Dr
- 29 Norwood Ave
- 10 Mountain Terrace
- 24 Malcolm Ct
- 386 Park St
- 391 Up Mountain Ave
Your Personal Tour Guide
Ask me questions while you tour the home.