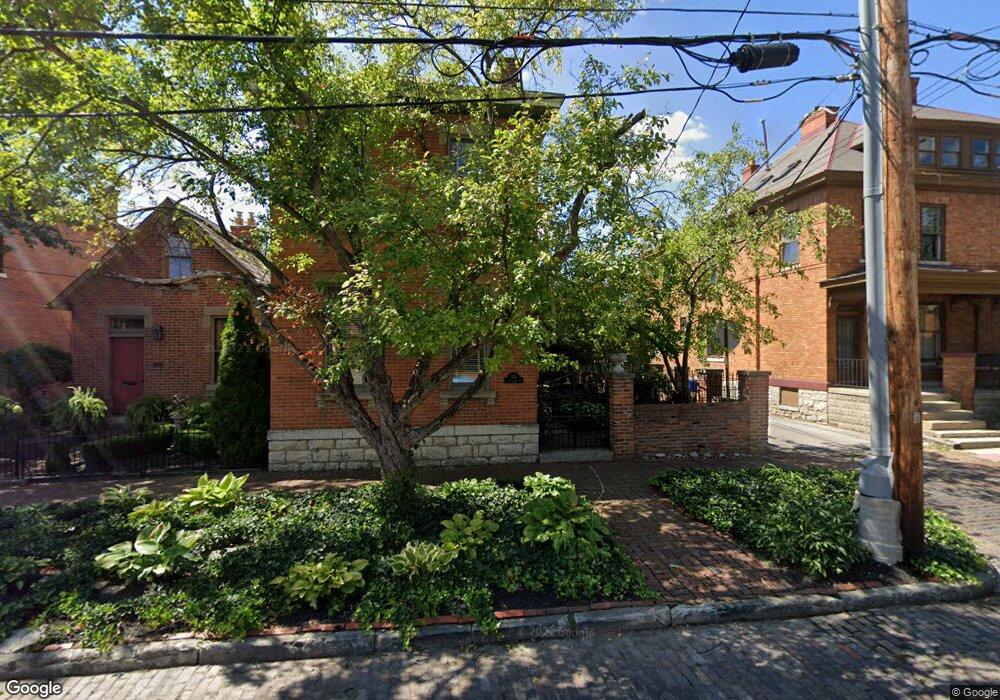
551 S Grant Ave Columbus, OH 43206
German Village NeighborhoodEstimated Value: $601,996 - $709,000
2
Beds
2
Baths
1,632
Sq Ft
$400/Sq Ft
Est. Value
About This Home
This home is located at 551 S Grant Ave, Columbus, OH 43206 and is currently estimated at $652,749, approximately $399 per square foot. 551 S Grant Ave is a home located in Franklin County with nearby schools including Siebert Elementary School, South High School, and South Columbus Preparatory Academy.
Ownership History
Date
Name
Owned For
Owner Type
Purchase Details
Closed on
Feb 11, 2014
Sold by
Thompson Richard E and Thompson Pamela J
Bought by
Thompson Pamela J and The Pamela J Thompson
Current Estimated Value
Purchase Details
Closed on
Jun 9, 2011
Sold by
Stump Charles D and Khan Rasheeda
Bought by
Thompson Richard E and Thompson Pamela J
Home Financials for this Owner
Home Financials are based on the most recent Mortgage that was taken out on this home.
Original Mortgage
$280,000
Outstanding Balance
$180,071
Interest Rate
3.25%
Mortgage Type
New Conventional
Estimated Equity
$472,678
Purchase Details
Closed on
Jan 5, 1999
Sold by
Stump Charles David and Stump Charles A
Bought by
Stump Charles D and Khan Rasheeda
Home Financials for this Owner
Home Financials are based on the most recent Mortgage that was taken out on this home.
Original Mortgage
$122,500
Interest Rate
6.8%
Purchase Details
Closed on
Sep 10, 1993
Bought by
Stump Charles D
Purchase Details
Closed on
Sep 5, 1990
Purchase Details
Closed on
Sep 1, 1985
Create a Home Valuation Report for This Property
The Home Valuation Report is an in-depth analysis detailing your home's value as well as a comparison with similar homes in the area
Home Values in the Area
Average Home Value in this Area
Purchase History
| Date | Buyer | Sale Price | Title Company |
|---|---|---|---|
| Thompson Pamela J | -- | None Available | |
| Thompson Richard E | $350,000 | Amerititle | |
| Stump Charles D | -- | -- | |
| Stump Charles D | -- | -- | |
| -- | $175,000 | -- | |
| -- | $84,000 | -- |
Source: Public Records
Mortgage History
| Date | Status | Borrower | Loan Amount |
|---|---|---|---|
| Open | Thompson Richard E | $280,000 | |
| Closed | Stump Charles D | $122,500 |
Source: Public Records
Tax History Compared to Growth
Tax History
| Year | Tax Paid | Tax Assessment Tax Assessment Total Assessment is a certain percentage of the fair market value that is determined by local assessors to be the total taxable value of land and additions on the property. | Land | Improvement |
|---|---|---|---|---|
| 2024 | $8,219 | $192,930 | $108,890 | $84,040 |
| 2023 | $8,142 | $192,920 | $108,885 | $84,035 |
| 2022 | $7,339 | $150,260 | $46,200 | $104,060 |
| 2021 | $7,352 | $150,260 | $46,200 | $104,060 |
| 2020 | $7,362 | $150,260 | $46,200 | $104,060 |
| 2019 | $7,363 | $130,130 | $40,180 | $89,950 |
| 2018 | $6,612 | $130,130 | $40,180 | $89,950 |
| 2017 | $7,206 | $130,130 | $40,180 | $89,950 |
| 2016 | $7,054 | $115,230 | $32,940 | $82,290 |
| 2015 | $6,403 | $115,230 | $32,940 | $82,290 |
| 2014 | $6,419 | $115,230 | $32,940 | $82,290 |
| 2013 | $3,002 | $109,725 | $31,360 | $78,365 |
Source: Public Records
Map
Nearby Homes
- 318 Berger Alley
- 616 S Grant Ave Unit 3B
- 300 Jackson St
- 564 Lathrop St
- 335 E Beck St Unit 337
- 598 Lathrop St
- 628 S Grant Ave
- 639 S Grant Ave
- 279-281 E Beck St
- 606 S 9th St
- 278 E Sycamore St
- 307 E Sycamore St
- 707 Sycamore Place Unit 707
- 487 E Beck St
- 718 S 6th St
- 688 S 5th St
- 161 Jackson St
- 418 Forest St
- 169 E Livingston Ave
- 606 Rader Alley
- 553 S Grant Ave
- 557 S Grant Ave
- 563 S Grant Ave
- 563 S Grant Ave
- 328 Jackson St
- 565 S Grant Ave
- 318 Jackson St
- 560 S Grant Ave
- 546 S Grant Ave
- 343 E Livingston Ave
- 347 E Livingston Ave
- 333 E Livingston Ave
- 568 S Grant Ave
- 317 E Blenkner St
- 325 E Livingston Ave
- 329 Jackson St
- 314 Jackson St
- 356 Jackson St Unit 356
- 313 E Blenkner St
- 323 E Livingston Ave