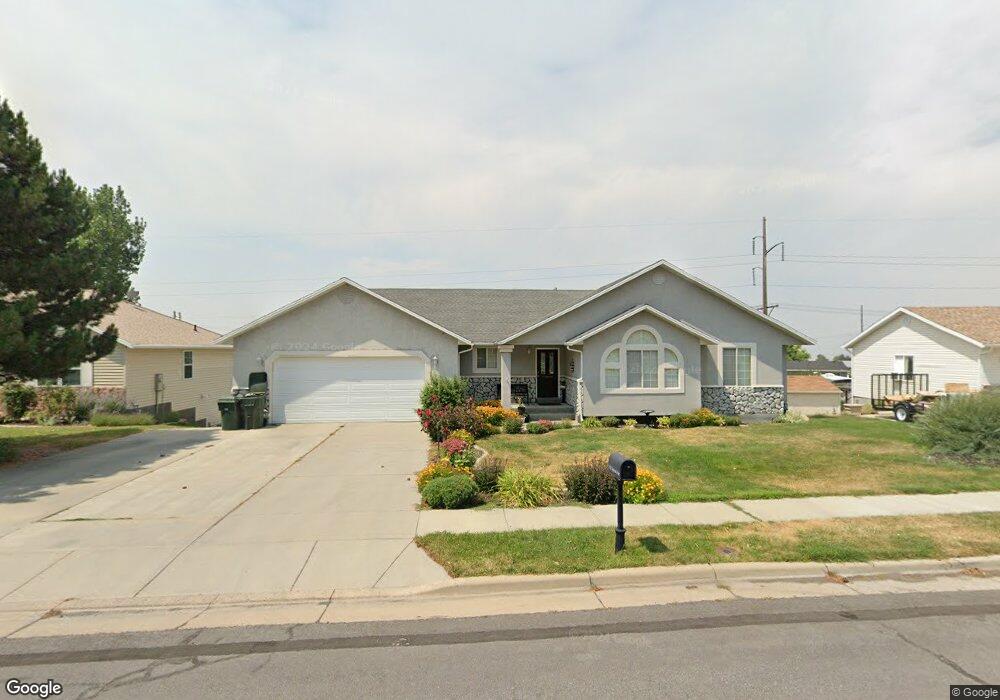
551 Tamarack Dr Tooele, UT 84074
Estimated Value: $484,000 - $548,000
4
Beds
3
Baths
3,496
Sq Ft
$149/Sq Ft
Est. Value
About This Home
This home is located at 551 Tamarack Dr, Tooele, UT 84074 and is currently estimated at $520,019, approximately $148 per square foot. 551 Tamarack Dr is a home located in Tooele County with nearby schools including Sterling Elementary School, Tooele Junior High School, and Tooele High School.
Ownership History
Date
Name
Owned For
Owner Type
Purchase Details
Closed on
Aug 22, 2019
Sold by
West Rachel
Bought by
Curfew Robert David and Curfew Rachael
Current Estimated Value
Home Financials for this Owner
Home Financials are based on the most recent Mortgage that was taken out on this home.
Original Mortgage
$250,267
Outstanding Balance
$219,188
Interest Rate
3.7%
Mortgage Type
VA
Estimated Equity
$300,831
Purchase Details
Closed on
Aug 27, 2012
Sold by
Lamb Zada
Bought by
West Rachael
Home Financials for this Owner
Home Financials are based on the most recent Mortgage that was taken out on this home.
Original Mortgage
$210,900
Interest Rate
3.53%
Mortgage Type
New Conventional
Purchase Details
Closed on
Feb 4, 2010
Sold by
Lamb Zada
Bought by
Lamb Zada and Zada Lamb Living Trust
Purchase Details
Closed on
May 12, 2006
Sold by
Coon Nancy L
Bought by
Lamb Carlysle and Lamb Zada
Create a Home Valuation Report for This Property
The Home Valuation Report is an in-depth analysis detailing your home's value as well as a comparison with similar homes in the area
Home Values in the Area
Average Home Value in this Area
Purchase History
| Date | Buyer | Sale Price | Title Company |
|---|---|---|---|
| Curfew Robert David | -- | Silver Leaf Title Ins Agcy | |
| West Rachael | -- | Magellan Title Ach | |
| Lamb Zada | -- | None Available | |
| Lamb Carlysle | -- | First American Title Agency |
Source: Public Records
Mortgage History
| Date | Status | Borrower | Loan Amount |
|---|---|---|---|
| Open | Curfew Robert David | $250,267 | |
| Previous Owner | West Rachael | $210,900 |
Source: Public Records
Tax History Compared to Growth
Tax History
| Year | Tax Paid | Tax Assessment Tax Assessment Total Assessment is a certain percentage of the fair market value that is determined by local assessors to be the total taxable value of land and additions on the property. | Land | Improvement |
|---|---|---|---|---|
| 2025 | $3,230 | $489,874 | $134,000 | $355,874 |
| 2024 | $3,537 | $269,961 | $73,700 | $196,261 |
| 2023 | $3,537 | $271,256 | $70,290 | $200,966 |
| 2022 | $3,040 | $261,508 | $70,290 | $191,218 |
| 2021 | $2,952 | $212,409 | $28,463 | $183,946 |
| 2020 | $3,094 | $386,197 | $51,750 | $334,447 |
| 2019 | $3,145 | $386,197 | $51,750 | $334,447 |
| 2018 | $2,993 | $348,430 | $65,000 | $283,430 |
| 2017 | $2,220 | $306,657 | $40,000 | $266,657 |
| 2016 | $1,807 | $149,532 | $22,000 | $127,532 |
| 2015 | $1,807 | $131,396 | $0 | $0 |
| 2014 | -- | $131,396 | $0 | $0 |
Source: Public Records
Map
Nearby Homes
- 624 Mountaineer Cir
- 363 Oak Hill Dr
- 299 Sage Cir
- 196 S 6th St
- 557 Elk Meadow Loop
- 5 S Bench Mark Village Unit 5
- 426 S Deer Hollow Dr
- 265 E Serenity Ave Unit 1004
- 7967 N Spring Valley Ln Unit 321
- 1918 N Patchwork Ave
- 704 S Deer Hollow Dr
- 214 S 3rd St
- 11 Benchmark Village
- 702 Elk Meadow Loop
- 524 Oak Ln Unit 3
- 558 Oak Ln
- 185 Crest Cir
- 433 E 100 S
- 440 Highland Dr
- 775 Elk Meadow Loop
- 539 Tamarack Dr
- 492 Gordon Cir
- 561 Tamarack Dr
- 552 Tamarack Dr
- 482 Gordon Cir
- 573 E Tamarack Dr
- 574 Tamarack Dr
- 573 Tamarack Dr
- 540 Tamarack Dr
- 491 Gordon Cir
- 495 Tamarack Dr Unit 1
- 522 Tamarack Dr
- 522 Tamarack Dr Unit 2
- 472 Gordon Cir
- 481 Gordon Cir Unit 25
- 481 Gordon Cir
- 572 Skyline Dr
- 560 Skyline Dr
- 517 Mountaineer Dr
- 471 Gordon Cir