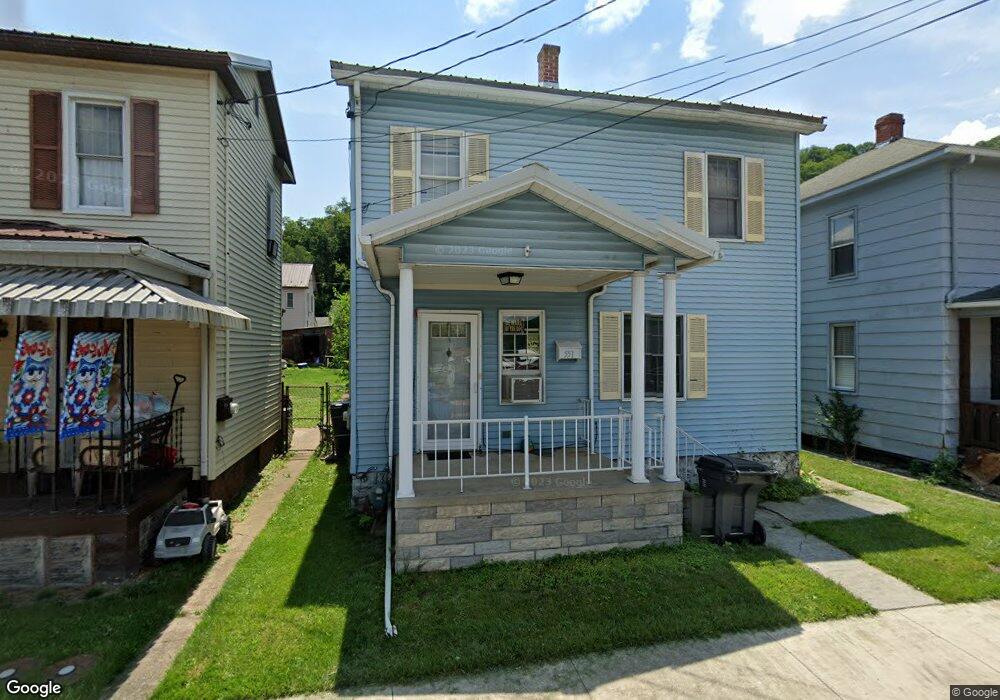
551 W Piedmont St Keyser, WV 26726
Estimated Value: $118,000 - $137,582
3
Beds
2
Baths
1,274
Sq Ft
$103/Sq Ft
Est. Value
About This Home
This home is located at 551 W Piedmont St, Keyser, WV 26726 and is currently estimated at $130,896, approximately $102 per square foot. 551 W Piedmont St is a home located in Mineral County.
Ownership History
Date
Name
Owned For
Owner Type
Purchase Details
Closed on
Oct 27, 2021
Sold by
Myers Joshua and Myers Sabrina
Bought by
Myers Sabrina
Current Estimated Value
Purchase Details
Closed on
Aug 26, 2021
Sold by
Myers Joshua and Myers Sabrina
Bought by
Myers Sabrina
Home Financials for this Owner
Home Financials are based on the most recent Mortgage that was taken out on this home.
Original Mortgage
$68,311
Outstanding Balance
$62,085
Interest Rate
3.01%
Mortgage Type
FHA
Estimated Equity
$68,811
Purchase Details
Closed on
Apr 17, 2018
Sold by
Hawk Nancy
Bought by
Myers Joshua and Myers Sabrina
Home Financials for this Owner
Home Financials are based on the most recent Mortgage that was taken out on this home.
Original Mortgage
$64,990
Interest Rate
4.43%
Mortgage Type
New Conventional
Purchase Details
Closed on
Sep 29, 2005
Sold by
Fraley Christopher M and Fraley Miller Mary Shannon
Bought by
Hawk Nancy L
Home Financials for this Owner
Home Financials are based on the most recent Mortgage that was taken out on this home.
Original Mortgage
$3,500
Interest Rate
5.78%
Create a Home Valuation Report for This Property
The Home Valuation Report is an in-depth analysis detailing your home's value as well as a comparison with similar homes in the area
Home Values in the Area
Average Home Value in this Area
Purchase History
| Date | Buyer | Sale Price | Title Company |
|---|---|---|---|
| Myers Sabrina | -- | None Available | |
| Myers Sabrina | -- | None Available | |
| Myers Joshua | $67,000 | None Available | |
| Hawk Nancy L | $60,000 | -- |
Source: Public Records
Mortgage History
| Date | Status | Borrower | Loan Amount |
|---|---|---|---|
| Open | Myers Sabrina | $68,311 | |
| Closed | Myers Joshua | $64,990 | |
| Previous Owner | Hawk Nancy L | $3,500 | |
| Previous Owner | Hawk Nancy L | $57,000 |
Source: Public Records
Tax History Compared to Growth
Tax History
| Year | Tax Paid | Tax Assessment Tax Assessment Total Assessment is a certain percentage of the fair market value that is determined by local assessors to be the total taxable value of land and additions on the property. | Land | Improvement |
|---|---|---|---|---|
| 2025 | $748 | $47,700 | $3,420 | $44,280 |
| 2024 | $748 | $45,900 | $3,420 | $42,480 |
| 2023 | $720 | $44,520 | $3,420 | $41,100 |
| 2022 | $698 | $44,520 | $3,420 | $41,100 |
| 2021 | $698 | $44,520 | $3,420 | $41,100 |
| 2020 | $674 | $42,960 | $3,420 | $39,540 |
| 2019 | $674 | $42,960 | $3,420 | $39,540 |
| 2018 | $674 | $42,960 | $3,420 | $39,540 |
| 2017 | $674 | $42,960 | $3,420 | $39,540 |
| 2016 | $674 | $42,960 | $3,420 | $39,540 |
| 2015 | $674 | $42,960 | $3,420 | $39,540 |
| 2014 | $674 | $42,960 | $3,420 | $39,540 |
Source: Public Records
Map
Nearby Homes
- 44 Vernon St
- 480 Barnes St
- 351 W Piedmont St
- 192 Carroll Ave
- 370 Carroll Ave
- 339 D St
- 99 Gilmore St
- 150 152 E Piedmont St
- 81 James St
- 117 W Piedmont St
- 22001 Westernport Rd SW
- 325 Valley View Ave
- 99 Lee St
- 323 Richmond St
- 21416 Chesapeake Ave SW
- 60 Maple Ave Unit 62
- 139 S Main St
- 70 E Piedmont St
- 149 & 151 E Piedmont St
- 168 N Main St
- 547 W Piedmont St
- 543 W Piedmont St
- 537 W Piedmont St
- 555 W Piedmont St
- 546 W Piedmont St
- 550 W Piedmont St
- 538 W Piedmont St
- 565 W Piedmont St
- 28 G St
- 566 W Piedmont St
- 564 W Piedmont St
- 31 G St
- 517 W Piedmont St
- 577 W Piedmont St
- 522 W Piedmont St
- 513 W Piedmont St
- 575 W Piedmont St
- 36 G St
- 516 W Piedmont St
- 580 W Piedmont St