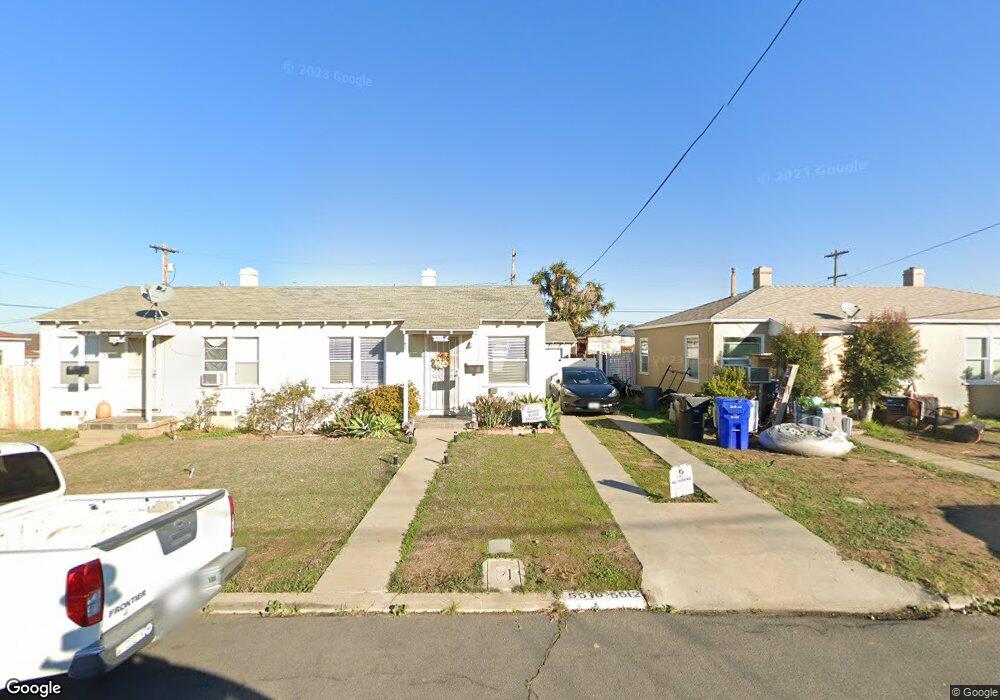
5510 Gables St Unit 12 San Diego, CA 92139
Paradise Hills NeighborhoodEstimated Value: $520,000 - $665,598
2
Beds
2
Baths
1,012
Sq Ft
$570/Sq Ft
Est. Value
About This Home
This home is located at 5510 Gables St Unit 12, San Diego, CA 92139 and is currently estimated at $576,866, approximately $570 per square foot. 5510 Gables St Unit 12 is a home located in San Diego County with nearby schools including Paradise Hills Elementary School, Bell Middle School, and Morse High School.
Ownership History
Date
Name
Owned For
Owner Type
Purchase Details
Closed on
Mar 15, 2016
Sold by
Rahib Raja M and Rahib Vera
Bought by
Rahib Family Trust and Rahib Vera Raja
Current Estimated Value
Purchase Details
Closed on
Jul 29, 2003
Sold by
Wach Clyde
Bought by
Rahib Raja M and Rahib Vera
Home Financials for this Owner
Home Financials are based on the most recent Mortgage that was taken out on this home.
Original Mortgage
$130,900
Outstanding Balance
$67,636
Interest Rate
8.05%
Mortgage Type
Purchase Money Mortgage
Estimated Equity
$509,230
Purchase Details
Closed on
Jan 14, 1996
Sold by
Fletcher Lois L
Bought by
Fletcher Lois L
Create a Home Valuation Report for This Property
The Home Valuation Report is an in-depth analysis detailing your home's value as well as a comparison with similar homes in the area
Home Values in the Area
Average Home Value in this Area
Purchase History
| Date | Buyer | Sale Price | Title Company |
|---|---|---|---|
| Rahib Family Trust | -- | None Available | |
| Rahib Raja M | $187,000 | First American Title | |
| Fletcher Lois L | -- | -- |
Source: Public Records
Mortgage History
| Date | Status | Borrower | Loan Amount |
|---|---|---|---|
| Open | Rahib Raja M | $130,900 |
Source: Public Records
Tax History Compared to Growth
Tax History
| Year | Tax Paid | Tax Assessment Tax Assessment Total Assessment is a certain percentage of the fair market value that is determined by local assessors to be the total taxable value of land and additions on the property. | Land | Improvement |
|---|---|---|---|---|
| 2025 | $3,237 | $265,857 | $142,171 | $123,686 |
| 2024 | $3,237 | $260,645 | $139,384 | $121,261 |
| 2023 | $3,165 | $255,535 | $136,651 | $118,884 |
| 2022 | $3,081 | $250,525 | $133,972 | $116,553 |
| 2021 | $3,060 | $245,614 | $131,346 | $114,268 |
| 2020 | $3,023 | $243,097 | $130,000 | $113,097 |
| 2019 | $2,970 | $238,331 | $127,451 | $110,880 |
| 2018 | $2,777 | $233,658 | $124,952 | $108,706 |
| 2017 | $2,711 | $229,077 | $122,502 | $106,575 |
| 2016 | $2,667 | $224,586 | $120,100 | $104,486 |
| 2015 | $2,628 | $221,213 | $118,296 | $102,917 |
| 2014 | $2,588 | $216,880 | $115,979 | $100,901 |
Source: Public Records
Map
Nearby Homes
- 5756 Midwick St
- 2220 Rachael Ave
- 1934 Altamont Ct
- 2245 S Lanoitan Ave
- 2877 Ridgeway Dr
- 0 Ridgeway Dr Unit PTP2501261
- 2579 Reo Dr
- 1504 Euclid Ave
- 2125 Prospect St
- 2761 Hopkins St
- 2320 Euclid Ave Unit 1
- 2862 Callejon
- 6127 Winchester St
- 5762 Calle Sal si Puedes
- 751 Paradise Way
- 3600 Paradise Valley Rd
- 3131 Valley Rd Unit 17
- 5865 Reo Terrace Unit B
- 5865 Reo Terrace Unit A
- 5875 Reo Terrace Unit E
- 5518 Gables St Unit 20
- 5506 Gables St Unit A
- 5502 Gables St Unit 6
- 5512 Gables St
- 5528 Gables St
- 5519 Potomac St
- 5527 Potomac St
- 5511 Potomac St
- 5536 Gables St
- 5505 Gables St
- 5535 Potomac St
- 5501 Potomac St
- 5519 Gables St
- 2265 Rachael Ave Unit B
- 5544 Gables St
- 5527 Gables St
- 1836 & 40 Rachael Ave
- 5543 Potomac St
- 1832 Rachael Ave
- 1824 Rachael Ave