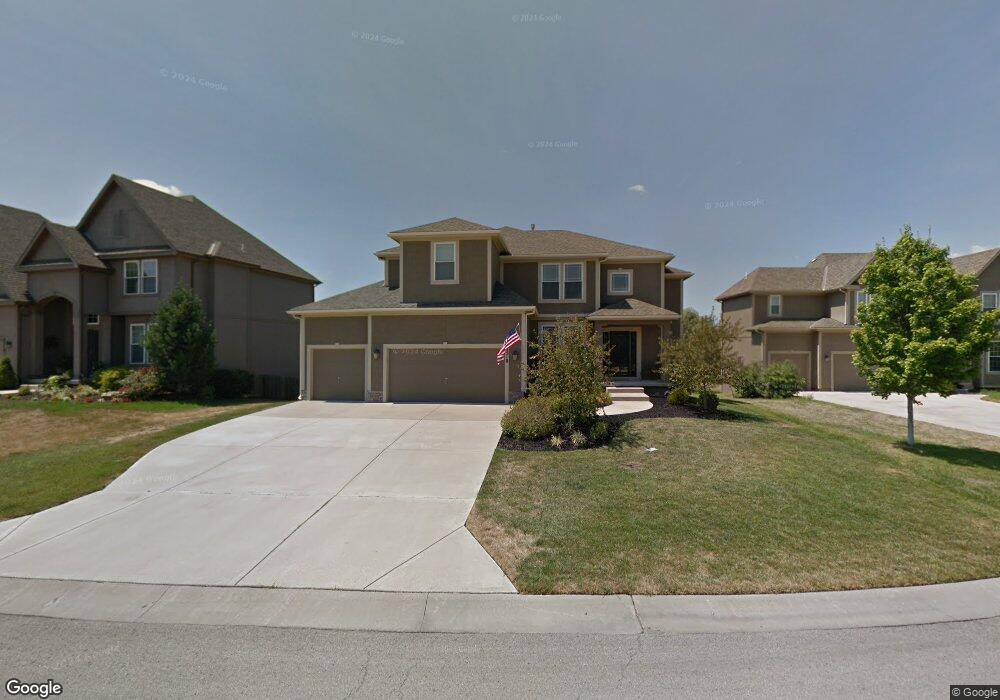
5510 Hilltop Dr Shawnee, KS 66226
Estimated Value: $483,138 - $530,000
4
Beds
4
Baths
2,177
Sq Ft
$234/Sq Ft
Est. Value
About This Home
This home is located at 5510 Hilltop Dr, Shawnee, KS 66226 and is currently estimated at $510,035, approximately $234 per square foot. 5510 Hilltop Dr is a home located in Johnson County with nearby schools including Prairie Ridge Elementary School, Monticello Trails Middle School, and Mill Valley High School.
Ownership History
Date
Name
Owned For
Owner Type
Purchase Details
Closed on
May 17, 2021
Sold by
Oroak J Patrick
Bought by
Oroak J Patrick and John P Oroak Living Trust
Current Estimated Value
Purchase Details
Closed on
Oct 15, 2010
Sold by
Manirath Xaiya and Manirath Kara
Bought by
Oroark J Patrick
Purchase Details
Closed on
May 29, 2007
Sold by
Rodrock Homes Llc
Bought by
Manirath Xaiya and Manirath Kara
Home Financials for this Owner
Home Financials are based on the most recent Mortgage that was taken out on this home.
Original Mortgage
$239,460
Interest Rate
6.37%
Mortgage Type
New Conventional
Purchase Details
Closed on
Aug 1, 2005
Sold by
Grey Oaks L L C
Bought by
Concord Homes L L C
Create a Home Valuation Report for This Property
The Home Valuation Report is an in-depth analysis detailing your home's value as well as a comparison with similar homes in the area
Home Values in the Area
Average Home Value in this Area
Purchase History
| Date | Buyer | Sale Price | Title Company |
|---|---|---|---|
| Oroak J Patrick | -- | None Available | |
| Oroark J Patrick | -- | Continental Title | |
| Manirath Xaiya | -- | First American Title Insuran | |
| Concord Homes L L C | -- | First American Title |
Source: Public Records
Mortgage History
| Date | Status | Borrower | Loan Amount |
|---|---|---|---|
| Previous Owner | Manirath Xaiya | $239,460 |
Source: Public Records
Tax History
| Year | Tax Paid | Tax Assessment Tax Assessment Total Assessment is a certain percentage of the fair market value that is determined by local assessors to be the total taxable value of land and additions on the property. | Land | Improvement |
|---|---|---|---|---|
| 2025 | $5,943 | $50,957 | $12,167 | $38,790 |
| 2024 | $5,943 | $51,060 | $11,516 | $39,544 |
| 2023 | $5,926 | $50,381 | $10,964 | $39,417 |
| 2022 | $5,661 | $47,150 | $10,439 | $36,711 |
| 2021 | $5,049 | $40,446 | $9,489 | $30,957 |
| 2020 | $4,801 | $38,111 | $9,489 | $28,622 |
| 2019 | $4,727 | $36,973 | $8,631 | $28,342 |
| 2018 | $4,897 | $37,973 | $7,849 | $30,124 |
| 2017 | $4,882 | $36,938 | $6,822 | $30,116 |
| 2016 | $4,804 | $35,903 | $6,822 | $29,081 |
| 2015 | $4,699 | $34,477 | $6,822 | $27,655 |
| 2013 | -- | $32,982 | $6,822 | $26,160 |
Source: Public Records
Map
Nearby Homes
- 22115 W 51st Terrace
- 21703 W 57th Terrace
- 24621 W 60th St
- 5019 Mccoy St
- 21811 W 51st St
- 21217 W 55th Terrace
- 21526 W 51st Terrace
- 5002 Woodsonia Dr
- 23650 W 56th St
- 6105 Noreston St
- 5200 Meadowsweet Ln
- 22625 W 49th St
- 23610 W 53rd St
- 5587 Gleason Rd
- 21613 W 61st St
- 20921 W 52nd Terrace
- 21704 W 49th St
- 6118 Lewis Dr
- 23811 W 59th Terrace
- 6122 Lewis Dr
- 5514 Hilltop Dr
- 5506 Hilltop Dr
- 5525 Aminda St
- 5518 Hilltop Dr
- 5502 Hilltop Dr
- 5521 Aminda St
- 5529 Aminda St
- 5511 Hilltop Dr
- 5507 Hilltop Dr
- 5515 Hilltop Dr
- 5522 Hilltop Dr
- 5503 Hilltop Dr
- 5533 Aminda St
- 5517 Aminda St
- 5519 Hilltop Dr
- 5523 Hilltop Dr
- 5526 Hilltop Dr
- 5537 Aminda St
- 5513 Aminda St
- 5520 Aminda St
Your Personal Tour Guide
Ask me questions while you tour the home.