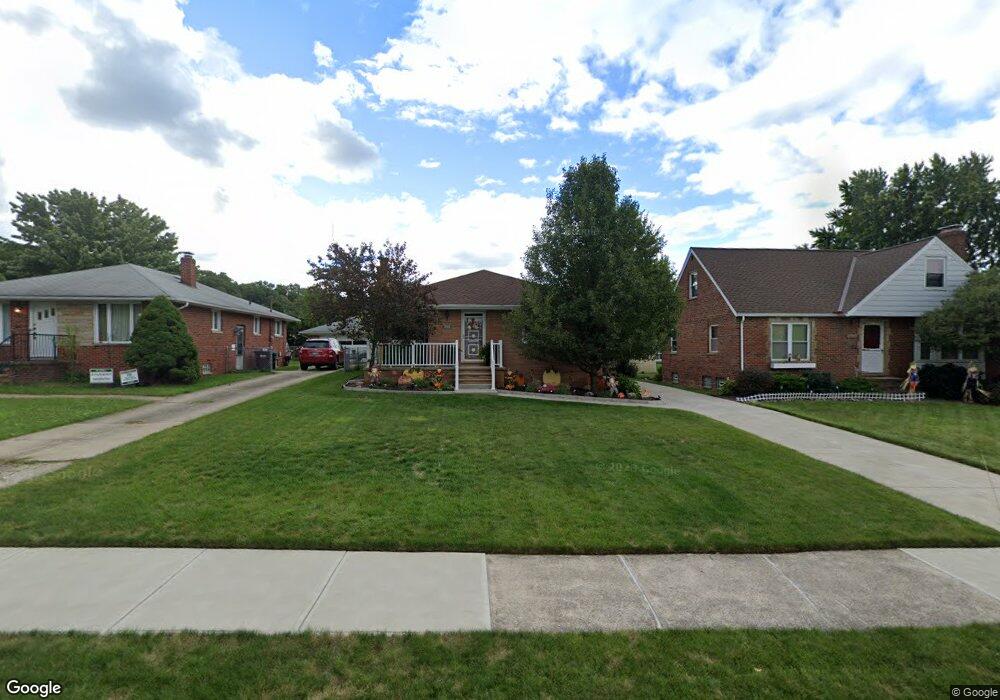
5511 Southington Dr Cleveland, OH 44129
Estimated Value: $224,907 - $240,000
3
Beds
2
Baths
1,243
Sq Ft
$187/Sq Ft
Est. Value
About This Home
This home is located at 5511 Southington Dr, Cleveland, OH 44129 and is currently estimated at $232,227, approximately $186 per square foot. 5511 Southington Dr is a home located in Cuyahoga County with nearby schools including Renwood Elementary School, Hillside Middle School, and Parma High School.
Ownership History
Date
Name
Owned For
Owner Type
Purchase Details
Closed on
Jan 17, 2018
Sold by
Weichsel Janice M
Bought by
Weichsel Michael John
Current Estimated Value
Purchase Details
Closed on
Oct 29, 2010
Sold by
Clark Wayne R and Clark Barbara
Bought by
Weichsel Janice M
Home Financials for this Owner
Home Financials are based on the most recent Mortgage that was taken out on this home.
Original Mortgage
$87,800
Outstanding Balance
$58,194
Interest Rate
4.36%
Mortgage Type
Purchase Money Mortgage
Estimated Equity
$174,033
Purchase Details
Closed on
Apr 20, 1989
Sold by
Clark Robert E
Bought by
Clark Grace E
Purchase Details
Closed on
Oct 19, 1983
Sold by
Fisher Walter P
Bought by
Clark Robert E
Purchase Details
Closed on
Mar 2, 1978
Bought by
Fisher Walter P
Purchase Details
Closed on
Mar 8, 1977
Sold by
Frick Emma
Bought by
William W Frick Bldg Co
Purchase Details
Closed on
Jan 1, 1975
Bought by
Frick Emma
Create a Home Valuation Report for This Property
The Home Valuation Report is an in-depth analysis detailing your home's value as well as a comparison with similar homes in the area
Home Values in the Area
Average Home Value in this Area
Purchase History
| Date | Buyer | Sale Price | Title Company |
|---|---|---|---|
| Weichsel Michael John | -- | None Available | |
| Weichsel Janice M | $110,000 | Chicago Title Insurance Co | |
| Clark Grace E | -- | -- | |
| Clark Robert E | $72,000 | -- | |
| Fisher Walter P | $68,000 | -- | |
| William W Frick Bldg Co | -- | -- | |
| Frick Emma | -- | -- |
Source: Public Records
Mortgage History
| Date | Status | Borrower | Loan Amount |
|---|---|---|---|
| Open | Weichsel Janice M | $87,800 |
Source: Public Records
Tax History Compared to Growth
Tax History
| Year | Tax Paid | Tax Assessment Tax Assessment Total Assessment is a certain percentage of the fair market value that is determined by local assessors to be the total taxable value of land and additions on the property. | Land | Improvement |
|---|---|---|---|---|
| 2024 | $4,275 | $71,085 | $12,530 | $58,555 |
| 2023 | $3,257 | $45,780 | $11,060 | $34,720 |
| 2022 | $3,226 | $45,780 | $11,060 | $34,720 |
| 2021 | $3,319 | $45,780 | $11,060 | $34,720 |
| 2020 | $2,907 | $35,210 | $8,510 | $26,710 |
| 2019 | $2,786 | $100,600 | $24,300 | $76,300 |
| 2018 | $2,802 | $35,210 | $8,510 | $26,710 |
| 2017 | $2,560 | $29,830 | $6,270 | $23,560 |
| 2016 | $2,544 | $29,830 | $6,270 | $23,560 |
| 2015 | $2,433 | $29,830 | $6,270 | $23,560 |
| 2014 | $2,433 | $30,420 | $6,410 | $24,010 |
Source: Public Records
Map
Nearby Homes
- 5700 Hollywood Dr
- 5415 Pelham Dr
- 6510 Belmere Dr
- 6189 W 54th St
- 5205 Woodrow Ave
- 6468 State Rd Unit L11
- 6921 Hollywood Dr
- 6701 Pelham Dr
- 4802 Grantwood Dr
- 6474 State Rd Unit I-10
- 5211 W Ridgewood Dr
- 6298 Chestnut Hills Dr
- 4507 Grantwood Dr
- 6610 Renwood Dr
- 6234 N Canterbury Rd
- 6431 W Ridgewood Dr
- 6227 Ridge Rd
- 5208 Orchard Park Dr
- 6480 State Rd Unit F10
- 5603 Allanwood Dr
- 5601 Southington Dr
- 5505 Southington Dr
- 5605 Southington Dr
- 5501 Southington Dr
- 5510 Hollywood Dr
- 5609 Southington Dr
- 5502 Hollywood Dr
- 5508 Southington Dr
- 5608 Hollywood Dr
- 5414 Hollywood Dr
- 5514 Southington Dr
- 6336 W 54th St
- 6342 W 54th St
- 5502 Southington Dr
- 6330 W 54th St
- 5615 Southington Dr
- 5604 Southington Dr
- 5414 Southington Dr
- 5614 Hollywood Dr
- 5608 Southington Dr