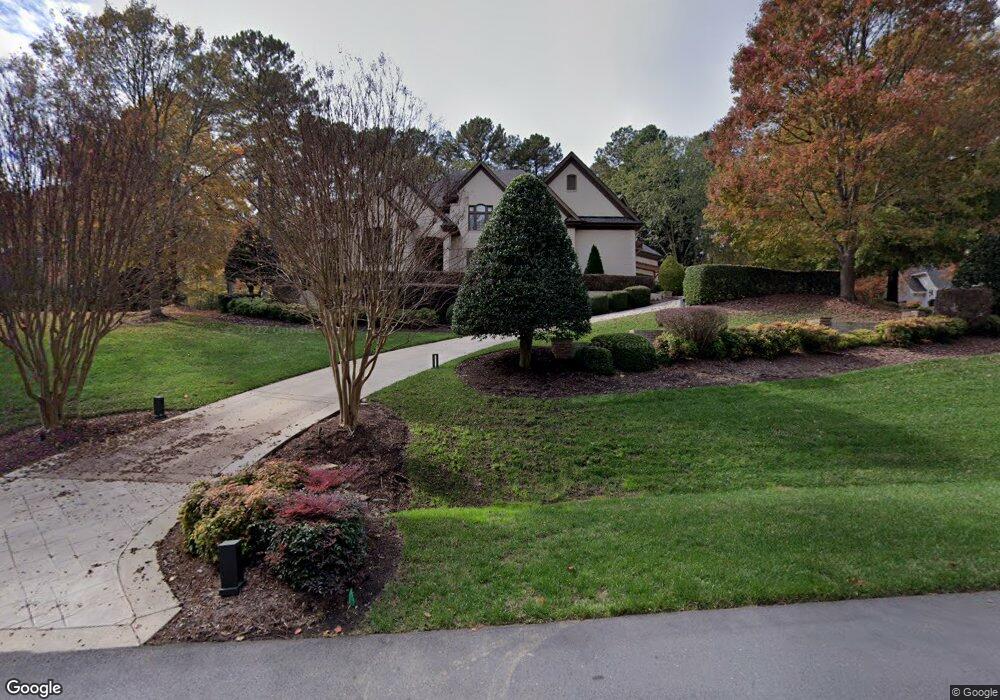
5513 Somerford Ln Raleigh, NC 27614
Falls Lake NeighborhoodEstimated Value: $1,569,562 - $1,671,000
4
Beds
5
Baths
5,000
Sq Ft
$320/Sq Ft
Est. Value
About This Home
This home is located at 5513 Somerford Ln, Raleigh, NC 27614 and is currently estimated at $1,599,891, approximately $319 per square foot. 5513 Somerford Ln is a home located in Wake County with nearby schools including Brassfield Elementary School, West Millbrook Middle School, and Millbrook High School.
Ownership History
Date
Name
Owned For
Owner Type
Purchase Details
Closed on
May 26, 2017
Sold by
Mcdevitt Robert M and Mcdevitt Judith M
Bought by
Barnes Allison D and Barnes Dennis K
Current Estimated Value
Home Financials for this Owner
Home Financials are based on the most recent Mortgage that was taken out on this home.
Original Mortgage
$709,665
Outstanding Balance
$589,483
Interest Rate
3.97%
Mortgage Type
New Conventional
Estimated Equity
$1,010,408
Purchase Details
Closed on
Oct 31, 2002
Sold by
Skywater Inc
Bought by
Mcdevitt Robert M and Mcdevitt Judith M
Home Financials for this Owner
Home Financials are based on the most recent Mortgage that was taken out on this home.
Original Mortgage
$650,000
Interest Rate
5.87%
Purchase Details
Closed on
Jul 7, 2000
Sold by
Honeycutt Properties Llc
Bought by
Skywater Inc
Home Financials for this Owner
Home Financials are based on the most recent Mortgage that was taken out on this home.
Original Mortgage
$85,500
Interest Rate
7.25%
Create a Home Valuation Report for This Property
The Home Valuation Report is an in-depth analysis detailing your home's value as well as a comparison with similar homes in the area
Home Values in the Area
Average Home Value in this Area
Purchase History
| Date | Buyer | Sale Price | Title Company |
|---|---|---|---|
| Barnes Allison D | $83,500 | None Available | |
| Mcdevitt Robert M | $814,500 | -- | |
| Skywater Inc | $95,000 | -- |
Source: Public Records
Mortgage History
| Date | Status | Borrower | Loan Amount |
|---|---|---|---|
| Open | Barnes Allison D | $709,665 | |
| Previous Owner | Mcdevitt Robert M | $650,000 | |
| Previous Owner | Skywater Inc | $85,500 |
Source: Public Records
Tax History Compared to Growth
Tax History
| Year | Tax Paid | Tax Assessment Tax Assessment Total Assessment is a certain percentage of the fair market value that is determined by local assessors to be the total taxable value of land and additions on the property. | Land | Improvement |
|---|---|---|---|---|
| 2025 | $9,036 | $1,409,573 | $240,000 | $1,169,573 |
| 2024 | $8,773 | $1,409,573 | $240,000 | $1,169,573 |
| 2023 | $7,963 | $1,018,741 | $168,000 | $850,741 |
| 2022 | $7,377 | $1,018,741 | $168,000 | $850,741 |
| 2021 | $7,179 | $1,018,741 | $168,000 | $850,741 |
| 2020 | $7,060 | $1,018,741 | $168,000 | $850,741 |
| 2019 | $7,634 | $932,311 | $168,000 | $764,311 |
| 2018 | $7,016 | $932,311 | $168,000 | $764,311 |
| 2017 | $6,649 | $932,311 | $168,000 | $764,311 |
| 2016 | $6,514 | $932,311 | $168,000 | $764,311 |
| 2015 | $6,380 | $915,718 | $154,000 | $761,718 |
| 2014 | $6,045 | $915,718 | $154,000 | $761,718 |
Source: Public Records
Map
Nearby Homes
- 10708 Trappers Creek Dr
- 917 Welland Ct
- 10721 Marabou Ct
- 904 Stonecutter Ct
- 9801 Honeycutt Rd
- 900 Stonecutter Ct
- 10912 Cahill Rd
- 9925 Koupela Dr
- 11100 Honeycutt Rd
- 4921 Foxridge Dr
- 4900 Foxridge Dr
- 1004 Tobiano Ln
- 4725 Saratoga Falls Ln
- 5420 Deer Forest Trail
- 6729 Greywalls Ln
- 4812 Parker Meadow Dr
- 11705 Durant Rd
- 1209 Ravens Point Cir
- 1508 Acres Way
- 308 Swans Mill Crossing
- 5509 Somerford Ln
- 10600 Hanarry Ct
- 5505 Somerford Ln
- 10604 Hanarry Ct
- 10601 Hanarry Ct
- 1120 Enderbury Dr
- 1116 Bilbury Ct
- 5504 Somerford Ln
- 10605 Honeycutt Rd
- 5501 Somerford Ln
- 1105 Bilbury Ct
- 1204 Enderbury Dr
- 1117 Bilbury Ct
- 10605 Hanarry Ct
- 5500 Somerford Ln
- 1109 Bilbury Ct
- 1113 Bilbury Ct
- 10608 Hanarry Ct
- 10609 Hanarry Ct
- 1208 Enderbury Dr