Estimated Value: $756,728 - $811,000
5
Beds
4
Baths
3,378
Sq Ft
$231/Sq Ft
Est. Value
About This Home
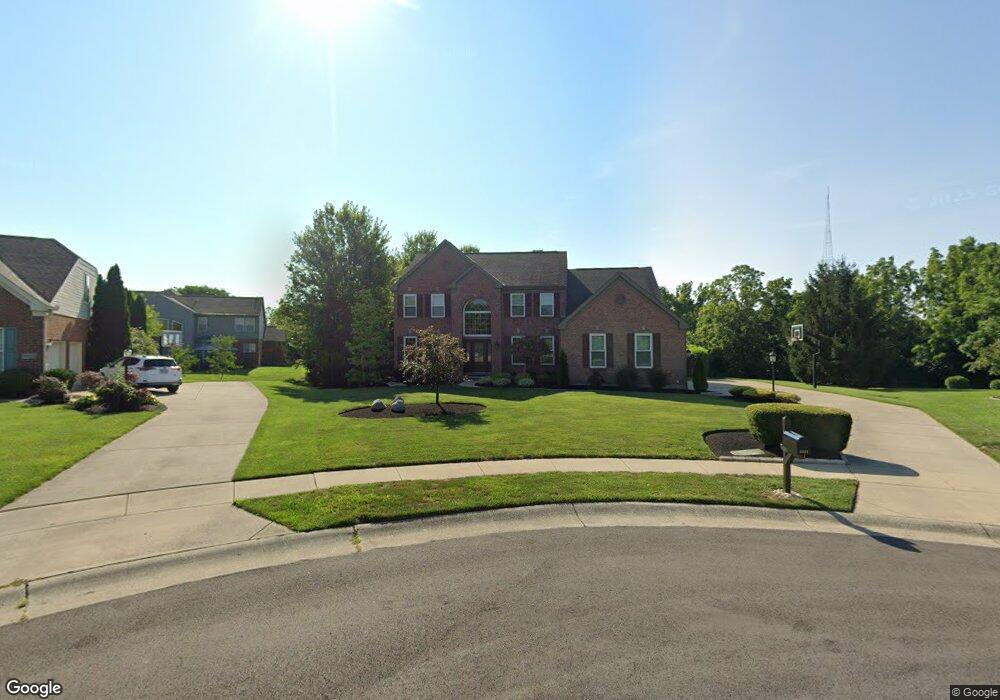
This home is located at 5514 Fairmeadow Ct, Mason, OH 45040 and is currently estimated at $780,682, approximately $231 per square foot. 5514 Fairmeadow Ct is a home located in Warren County with nearby schools including Mason Intermediate Elementary School, Mason Middle School, and William Mason High School.
Ownership History
Date
Name
Owned For
Owner Type
Purchase Details
Closed on
Aug 25, 2016
Sold by
Schaner Sherri L and Sherri L Schaner Trust
Bought by
Schaner Sherri L and Schaner Jeffrey P
Current Estimated Value
Purchase Details
Closed on
Mar 22, 2004
Sold by
Schaner Jeffrey P and Schaner Sherri L
Bought by
Schaner Sherri L and Sherri L Schaner Trust
Purchase Details
Closed on
May 9, 2000
Sold by
Drees Co
Bought by
Schaner Jeffrey P and Schaner Sherri L
Home Financials for this Owner
Home Financials are based on the most recent Mortgage that was taken out on this home.
Original Mortgage
$240,000
Outstanding Balance
$83,510
Interest Rate
8.24%
Mortgage Type
New Conventional
Estimated Equity
$697,172
Purchase Details
Closed on
Dec 17, 1999
Sold by
Tylersville Greenbriar L
Bought by
Drees Co
Create a Home Valuation Report for This Property
The Home Valuation Report is an in-depth analysis detailing your home's value as well as a comparison with similar homes in the area
Home Values in the Area
Average Home Value in this Area
Purchase History
| Date | Buyer | Sale Price | Title Company |
|---|---|---|---|
| Schaner Sherri L | -- | None Available | |
| Schaner Sherri L | -- | -- | |
| Schaner Jeffrey P | $303,115 | -- | |
| Drees Co | $92,984 | -- |
Source: Public Records
Mortgage History
| Date | Status | Borrower | Loan Amount |
|---|---|---|---|
| Open | Schaner Jeffrey P | $240,000 |
Source: Public Records
Tax History Compared to Growth
Tax History
| Year | Tax Paid | Tax Assessment Tax Assessment Total Assessment is a certain percentage of the fair market value that is determined by local assessors to be the total taxable value of land and additions on the property. | Land | Improvement |
|---|---|---|---|---|
| 2024 | $8,727 | $214,910 | $45,500 | $169,410 |
| 2023 | $7,759 | $161,378 | $26,705 | $134,673 |
| 2022 | $7,659 | $161,378 | $26,705 | $134,673 |
| 2021 | $7,256 | $161,378 | $26,705 | $134,673 |
| 2020 | $7,764 | $148,054 | $24,500 | $123,554 |
| 2019 | $7,139 | $148,054 | $24,500 | $123,554 |
| 2018 | $7,162 | $148,054 | $24,500 | $123,554 |
| 2017 | $6,491 | $125,251 | $20,993 | $104,258 |
| 2016 | $6,686 | $125,251 | $20,993 | $104,258 |
| 2015 | $6,700 | $125,251 | $20,993 | $104,258 |
| 2014 | $5,978 | $104,200 | $19,090 | $85,110 |
| 2013 | $5,991 | $133,760 | $24,500 | $109,260 |
Source: Public Records
Map
Nearby Homes
- 5513 Harvestdale Dr
- 5728 Running Fox Ln
- 5383 Wheatmore Ct
- 5791 Running Fox Ln
- 5280 Sunset Ridge Dr
- 6260 Lake Front
- 6134 Lakelyn Unit 300D
- 5815 Running Fox Ln
- Vanderburgh Plan at Ivy Lane
- Belleville Plan at Ivy Lane
- Buchanan Plan at Ivy Lane
- Alden Plan at Ivy Lane
- Naples Plan at Ivy Lane
- Quentin Plan at Ivy Lane
- Hialeah Plan at Ivy Lane
- Ashton Plan at Ivy Lane
- Beachwood Plan at Ivy Lane
- Saxon Plan at Ivy Lane
- 5787 Southwater Dr Unit 206H
- 6329 Caddies Way
- 5518 Fairmeadow Ct
- 5502 Fairmeadow Ct
- 6039 Green Meadow
- 6047 Green Meadow
- 5482 Fairmeadow Ct
- 5515 Fairmeadow Ct
- 5574 Glen Oak
- 6071 Green Meadow
- 5501 Fairmeadow Ct
- 5575 Glen Oak
- 5483 Fairmeadow Ct
- 6139 Green Meadow
- 5583 Glenbrook Ct
- 5582 Glen Oak
- 6103 Green Meadow
- 6161 Green Meadow
- 5583 Glen Brook
- 5578 Glenbrook Ct
- 6044 Green Meadow
- 5506 Harvestdale Dr